
Page 53 - UKZN Proceedings of the Conference Report
P. 53
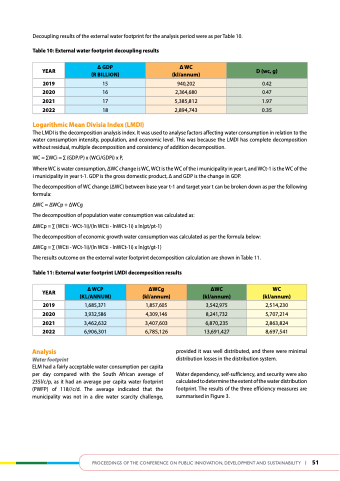
Decoupling results of the external water footprint for the analysis period were as per Table 10.
table 10: external water footprint decoupling results
year
2019 2020 2021 2022
Logarithmic Mean divisia Index (LMdI)
The LMDI is the decomposition analysis index. It was used to analyse factors affecting water consumption in relation to the water consumption intensity, population, and economic level. This was because the LMDI has complete decomposition without residual, multiple decomposition and consistency of addition decomposition.
WC = ∑WCi = ∑ (GDP/P) x (WCi/GDPi) x P,
Where WC is water consumption, ∆WC change is WC, WCt is the WC of the i municipality in year t, and WCt-1 is the WC of the i municipality in year t-1. GDP is the gross domestic product, ∆ and GDP is the change in GDP.
The decomposition of WC change (∆WC) between base year t-1 and target year t can be broken down as per the following formula:
∆WC = ∆WCp + ∆WCg
The decomposition of population water consumption was calculated as:
∆WCp = ∑ (WCti - WCt-1i)/(ln WCti - lnWCt-1i) x ln(pt/pt-1)
The decomposition of economic growth water consumption was calculated as per the formula below: ∆WCg = ∑ (WCti - WCt-1i)/(ln WCti - lnWCt-1i) x ln(gt/gt-1)
The results outcome on the external water footprint decomposition calculation are shown in Table 11.
table 11: external water footprint LMdI decomposition results
   ∆ gdP
(r BILLIoN)
  ∆ WC (kl/annum)
  d (wc, g)
 15
 940,202
 0.42
 16
 2,364,680
 0.47
 17
 5,385,812
 1.97
 18
  2,894,743
  0.35
            ∆ WCP (KL/aNNuM)
  ∆WCg (kl/annum)
  ∆WC (kl/annum)
  WC (kl/annum)
 1,685,371
 1,857,605
 3,542,975
 2,514,230
 3,932,586
 4,309,146
 8,241,732
 5,707,214
 3,462,632
 3,407,603
 6,870,235
 2,863,824
 6,906,301
  6,785,126
  13,691,427
  8,697,541
 year
2019 2020 2021 2022
analysis
Water footprint
ELM had a fairly acceptable water consumption per capita per day compared with the South African average of 235l/c/p, as it had an average per capita water footprint (PWFP) of 118//c/d. The average indicated that the municipality was not in a dire water scarcity challenge,
provided it was well distributed, and there were minimal distribution losses in the distribution system.
Water dependency, self-sufficiency, and security were also calculated to determine the extent of the water distribution footprint. The results of the three efficiency measures are summarised in Figure 3.
         Proceedings of the conference on Public innovation, develoPment and sustainability | 51
