
Page 54 - UKZN Proceedings of the Conference Report
P. 54
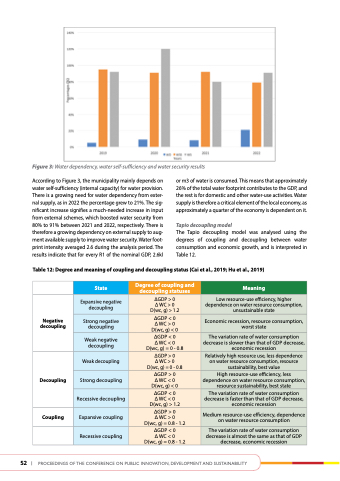
 Figure 3: Water dependency, water self-sufficiency and water security results
According to Figure 3, the municipality mainly depends on water self-sufficiency (internal capacity) for water provision. There is a growing need for water dependency from exter- nal supply, as in 2022 the percentage grew to 21%. The sig- nificant increase signifies a much-needed increase in input from external schemes, which boosted water security from 80% to 91% between 2021 and 2022, respectively. There is therefore a growing dependency on external supply to aug- ment available supply to improve water security. Water foot- print intensity averaged 2.6 during the analysis period. The results indicate that for every R1 of the nominal GDP, 2.6kl
or m3 of water is consumed. This means that approximately 26% of the total water footprint contributes to the GDP, and the rest is for domestic and other water-use activities. Water supply is therefore a critical element of the local economy, as approximately a quarter of the economy is dependent on it.
Tapio decoupling model
The Tapio decoupling model was analysed using the degrees of coupling and decoupling between water consumption and economic growth, and is interpreted in Table 12.
table 12: degree and meaning of coupling and decoupling status (Cai et al., 2019; hu et al., 2019)
Negative decoupling
decoupling
Coupling
   State
   degree of coupling and decoupling statuses
   Meaning
 Expansive negative decoupling
∆GDP > 0 ∆ WC > 0 D(wc, g) > 1.2
Low resource-use efficiency, higher dependence on water resource consumption, unsustainable state
 Strong negative decoupling
 ∆GDP < 0 ∆ WC > 0 D(wc, g) < 0
 Economic recession, resource consumption, worst state
 Weak negative decoupling
 ∆GDP < 0
∆ WC < 0 D(wc, g) = 0 - 0.8
 The variation rate of water consumption decrease is slower than that of GDP decrease, economic recession
 Weak decoupling
 ∆GDP > 0
∆ WC > 0 D(wc, g) = 0 - 0.8
 Relatively high resource use, less dependence on water resource consumption, resource sustainability, best value
 Strong decoupling
  ∆GDP > 0 ∆ WC < 0 D(wc, g) < 0
  High resource-use efficiency, less dependence on water resource consumption, resource sustainability, best state
 Recessive decoupling
∆GDP < 0 ∆ WC < 0 D(wc, g) > 1.2
The variation rate of water consumption decrease is faster than that of GDP decrease, economic recession
 Expansive coupling
 ∆GDP > 0
∆ WC > 0 D(wc, g) = 0.8 - 1.2
 Medium resource-use efficiency, dependence on water resource consumption
 Recessive coupling
  ∆GDP < 0
∆ WC < 0 D(wc, g) = 0.8 - 1.2
  The variation rate of water consumption decrease is almost the same as that of GDP decrease, economic recession
          52 | Proceedings of the conference on Public innovation, develoPment and sustainability
