
Page 55 - UKZN Proceedings of the Conference Report
P. 55
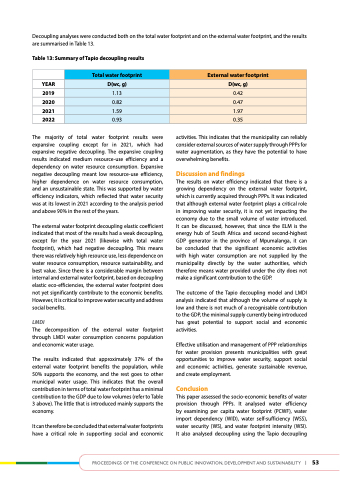
Decoupling analyses were conducted both on the total water footprint and on the external water footprint, and the results are summarised in Table 13.
table 13: Summary of tapio decoupling results
year 2019 2020 2021 2022
The majority of total water footprint results were expansive coupling except for in 2021, which had expansive negative decoupling. The expansive coupling results indicated medium resource-use efficiency and a dependency on water resource consumption. Expansive negative decoupling meant low resource-use efficiency, higher dependence on water resource consumption, and an unsustainable state. This was supported by water efficiency indicators, which reflected that water security was at its lowest in 2021 according to the analysis period and above 90% in the rest of the years.
The external water footprint decoupling elastic coefficient indicated that most of the results had a weak decoupling, except for the year 2021 (likewise with total water footprint), which had negative decoupling. This means there was relatively high resource use, less dependence on water resource consumption, resource sustainability, and best value. Since there is a considerable margin between internal and external water footprint, based on decoupling elastic eco-efficiencies, the external water footprint does not yet significantly contribute to the economic benefits. However, it is critical to improve water security and address social benefits.
LMDI
The decomposition of the external water footprint through LMDI water consumption concerns population and economic water usage.
The results indicated that approximately 37% of the external water footprint benefits the population, while 50% supports the economy, and the rest goes to other municipal water usage. This indicates that the overall contribution in terms of total water footprint has a minimal contribution to the GDP due to low volumes (refer to Table 3 above). The little that is introduced mainly supports the economy.
It can therefore be concluded that external water footprints have a critical role in supporting social and economic
activities. This indicates that the municipality can reliably consider external sources of water supply through PPPs for water augmentation, as they have the potential to have overwhelming benefits.
discussion and findings
The results on water efficiency indicated that there is a growing dependency on the external water footprint, which is currently acquired through PPPs. It was indicated that although external water footprint plays a critical role in improving water security, it is not yet impacting the economy due to the small volume of water introduced. It can be discussed, however, that since the ELM is the energy hub of South Africa and second second-highest GDP generator in the province of Mpumalanga, it can be concluded that the significant economic activities with high water consumption are not supplied by the municipality directly by the water authorities, which therefore means water provided under the city does not make a significant contribution to the GDP.
The outcome of the Tapio decoupling model and LMDI analysis indicated that although the volume of supply is low and there is not much of a recognisable contribution to the GDP, the minimal supply currently being introduced has great potential to support social and economic activities.
Effective utilisation and management of PPP relationships for water provision presents municipalities with great opportunities to improve water security, support social and economic activities, generate sustainable revenue, and create employment.
Conclusion
This paper assessed the socio-economic benefits of water provision through PPPs. It analysed water efficiency by examining per capita water footprint (PCWF), water import dependency (WID), water self-sufficiency (WSS), water security (WS), and water footprint intensity (WSI). It also analysed decoupling using the Tapio decoupling
   total water footprint
  external water footprint
 d(wc, g)
 d(wc, g)
 1.13
 0.42
 0.82
 0.47
 1.59
 1.97
 0.93
  0.35
          Proceedings of the conference on Public innovation, develoPment and sustainability | 53
