
Page 39 - Playhouse Annual Report 2021:22
P. 39
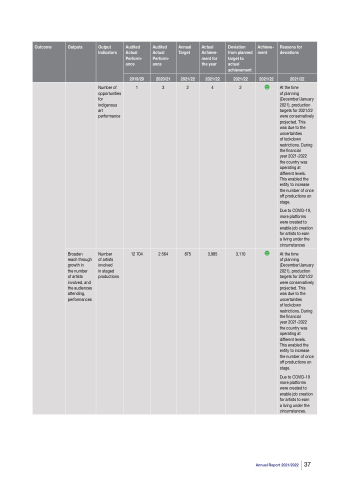
 Outcome
   Outputs
   Output Indicators
   Audited Actual Perform- ance
 Audited Actual Perform- ance
 Annual Target
  Actual Achieve- ment for the year
 Deviation from planned target to actual achievement
 Achieve- ment
  Reasons for deviations
 2019/20
  2020/21
  2021/22
   2021/22
  2021/22
  2021/22
   2021/22
      Number of opportunities for indigenous art performance
 1
 3
  2
 4
2
    At the time
of planning (December/January 2021), production targets for 2021/22 were conservatively projected. This
was due to the uncertainties
of lockdown restrictions. During the financial
year 2021-2022
the country was operating at different levels. This enabled the entity to increase the number of once off productions on stage.
Due to COVID-19, more platforms were created to enable job creation for artists to earn
a living under the circumstances
  Broaden reach through growth in
the number of artists involved, and the audiences attending, performances
   Number
of artists involved
in staged productions
   12 704
   2 564
    875
   3,985
  3,110
        At the time
of planning (December/January 2021), production targets for 2021/22 were conservatively projected. This
was due to the uncertainties
of lockdown restrictions. During the financial
year 2021-2022
the country was operating at different levels. This enabled the entity to increase the number of once off productions on stage.
Due to COVID-19 more platforms were created to enable job creation for artists to earn
a living under the circumstances.
   Annual Report 2021/2022 37
