
Page 74 - State of Biodiversity 2023-2024
P. 74
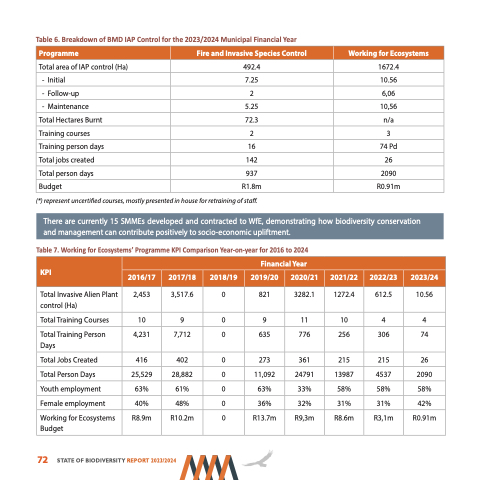
Table 6. Breakdown of BMD IAP Control for the 2023/2024 Municipal Financial Year
 Programme
  Fire and Invasive Species Control
  Working for Ecosystems
  Total area of IAP control (Ha) - Initial
- Follow-up
- Maintenance
Total Hectares Burnt Training courses Training person days Total jobs created Total person days Budget
492.4 1672.4 7.25 10.56 2 6,06 5.25 10,56
72.3 n/a 2 3
16 74 Pd 142 26 937 2090
R1.8m R0.91m
                              (*) represent uncertified courses, mostly presented in house for retraining of staff.
Table 7. Working for Ecosystems’ Programme KPI Comparison Year-on-year for 2016 to 2024
 There are currently 15 SMMEs developed and contracted to WfE, demonstrating how biodiversity conservation and management can contribute positively to socio-economic upliftment.
 KPI
 Financial Year
 2016/17
  2017/18
  2018/19
  2019/20
  2020/21
  2021/22
  2022/23
  2023/24
  Total Invasive Alien Plant control (Ha)
   2,453
  3,517.6
 0
  821
   3282.1
  1272.4
  612.5
  10.56
  Total Training Courses
Total Jobs Created Total Person Days Youth employment Female employment
10 9 0
416 402 0 25,529 28,882 0 63% 61% 0 40% 48% 0
9 11 10 4 4
 Total Training Person Days
  4,231
   7,712
  0
  635
  776
   256
   306
   74
 273 361 11,092 24791 63% 33% 36% 32%
215 215 26 13987 4537 2090 58% 58% 58% 31% 31% 42%
                            Working for Ecosystems Budget
  R8.9m
   R10.2m
  0
  R13.7m
  R9,3m
   R8.6m
   R3,1m
   R0.91m
  72 STATE OF BIODIVERSITY REPORT 2023/2024
