
Page 75 - State of Biodiversity 2023-2024
P. 75
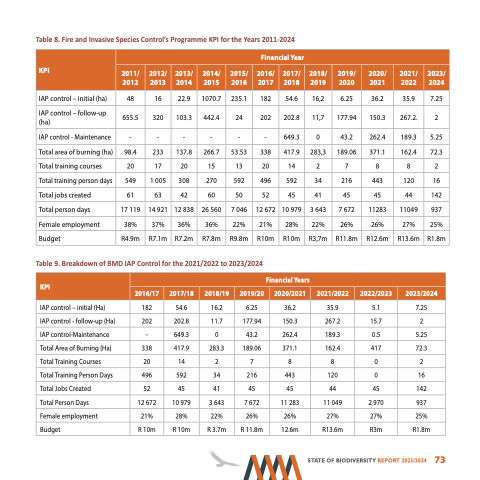
Table 8. Fire and Invasive Species Control’s Programme KPI for the Years 2011-2024
  KPI
  Financial Year
  2011/ 2012
    2012/ 2013
   2013/ 2014
  2014/ 2015
    2015/ 2016
  2016/ 2017
    2017/ 2018
   2018/ 2019
   2019/ 2020
  2020/ 2021
   2021/ 2022
    2023/ 2024
  IAP control – initial (ha)
IAP control – follow-up (ha)
IAP control - Maintenance Total area of burning (ha) Total training courses Total training person days Total jobs created
Total person days Female employment Budget
48 655.5
- 98.4 20 549 61 17 119 38% R4.9m
16 320
- 233 17
1 005 63 14 921 37% R7.1m
22.9 103.3
- 137.8 20 308 42 12 838 36% R7.2m
1070.7 442.4
- 266.7 15 270 60 26 560 36% R7.8m
235.1 24
- 53.53 13 592 50
7 046 22% R9.8m
182 202
- 338 20 496 52 12 672 21% R10m
54.6 202.8
649.3 417.9 14 592 45 10 979 28% R10m
16,2 11,7
0 283,3 2 34 41
3 643 22% R3,7m
6.25 177.94
43.2 189.06 7 216 45
7 672 26% R11.8m
36.2 150.3
262.4 371.1 8 443 45 11283 26% R12.6m
35.9 7.25
267.2. 2
189.3 5.25 162.4 72.3 8 2 120 16
44 142 11049 937 27% 25%
R13.6m R1.8m
                                                                                                                                  Table 9. Breakdown of BMD IAP Control for the 2021/2022 to 2023/2024
  KPI
Financial Years
        2016/17
2017/18
2018/19
2019/20
2020/2021
2021/2022
2022/2023
2023/2024
         6.25
36.2
35.9
5.1
7.25
     177.94
150.3
267.2
15.7
2
     43.2
262.4
189.3
0.5
5.25
       IAP control – initial (Ha)
IAP control - follow-up (Ha)
IAP control-Maintenance
Total Area of Burning (Ha)
Total Training Courses
Total Training Person Days
Total Jobs Created Total Person Days Female employment Budget
182
202
-
338
20
496
52 12 672 21% R 10m
54.6
202.8
649.3
417.9
14
592
45 10 979 28% R 10m
16.2
11.7
0
283.3
2
34
41
3 643 22% R 3.7m
189.06
7
216
45
7 672 26% R 11.8m
371.1
8
443
45 11 283 26% 12.6m
162.4
44 11 049 27% R13.6m
417
45 2 970 27% R3m
72.3
142 937 25% R1.8m
     8
 0
 2
 120
  0
  16
                                        STATE OF BIODIVERSITY REPORT 2023/2024 73
