
Page 83 - State of Biodiversity 2023-2024
P. 83
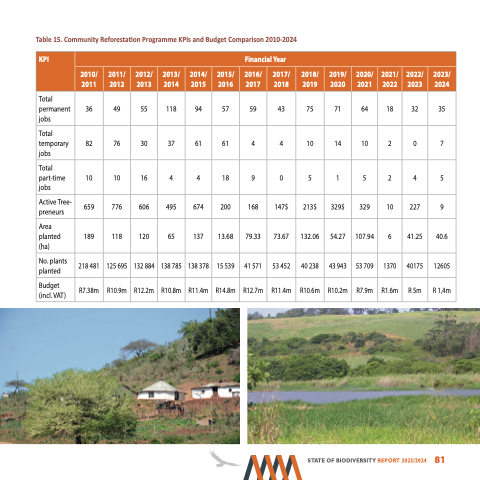
Table 15. Community Reforestation Programme KPIs and Budget Comparison 2010-2024
 KPI
  Financial Year
  2010/ 2011
   2011/ 2012
    2012/ 2013
  2013/ 2014
    2014/ 2015
   2015/ 2016
   2016/ 2017
  2017/ 2018
   2018/ 2019
   2019/ 2020
   2020/ 2021
    2021/ 2022
   2022/ 2023
   2023/ 2024
  Total permanent jobs
 36
 49
  55
118
  94
 57
 59
43
 75
 71
 64
  18
 32
 35
 Total temporary jobs
 82
 76
 30
 37
 61
  61
  4
 4
 10
 14
 10
 2
  0
  7
 Total part-time jobs
  10
  10
  16
  4
  4
   18
   9
  0
  5
  1
  5
  2
   4
   5
  Active Tree- preneurs
No. plants planted
Budget (incl. VAT)
659 776 606 495 674 200 168 147$ 213$ 329$ 329 10 227 9
 Area planted (ha)
  189
  118
  120
  65
  137
   13.68
   79.33
  73.67
  132.06
  54.27
  107.94
  6
   41.25
   40.6
 218 481 R7.38m
125 695 R10.9m
132 884 R12.2m
138 785 R10.8m
138 378 R11.4m
15 539 R14.8m
41 571 R12.7m
53 452 R11.4m
40 238 R10.6m
43 943 R10.2m
53 709 1370 R7.9m R1.6m
40175 R 5m
12605 R 1,4m
                                 STATE OF BIODIVERSITY REPORT 2023/2024
81
