Page 82 - IILMGSM Journal_Management Perspective
P. 82
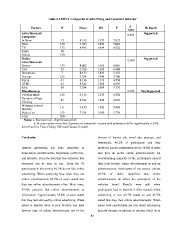
Table 2 ANOVA: Categories of Advertising and Consumer Behavior
Factors N Mean SD F p- H0 Result
value
Advertisements 0.551 Supported
Categories
In Store 17 8.912 1.957 7.833
Print 150 7.943 1.856 5.001
TV 133 8.485 1.664 6.822
Radio 50
Online 150
Online 0.640 Supported
Advertisements
Banner 133 8.002 1.465 6.001
Text 59 8.526 1.345 6.404
Interstitials 7 8.423 1.832 5.453
Pop ups 123 7.534 1.909 5.746
Opt in 67 8.136 1.173 4.554
HTML 43 8.542 1.281 4.893
Rich 68 7.534 1.989 5.776
Miscellaneous 0.035 Not Supported
Viewing Mode 143 8.136 1.273 4.554
Duration of Page 87 8.542 1.221 4.893
Viewing
Webpage context 111 8.453 1.882 5.443
function
Style of ad. 159 7.534 1.989 5.776
Total 500
Notes: a. Decision rule - Significant at 0.05
b. In cases where more than 2 groups are compared - means with postscripts differ significantly at 0.05,
from Post Hoc Tests (Tukey HSD and Games-Howell)
Conclusion choices of banner ads, email ads, pop-ups, and
interstitials, 40.2% of participants said they
Internet advertising has been described as preferred banner advertisements but 38.0% of users
nonsensical, uninformative, forgettable, ineffective, said they do prefer online advertisements. An
and intrusive. From the data that was collected, this overwhelming majority of the participants named
statement can be seen as true. From the 92 their least favorite online advertisement as pop-up
participants in this survey 46.7% do not like online advertisements. Participants of the survey, almost
advertising. When analyzing how often they see 65.2% of them, identified that online
online advertisements 83.7% of users stated that advertisements do affect the perception of the
they see online advertisements often. Most users, websites brand. Results were split when
57.6%, perceive that online advertisements as participants had to identify if they trusted online
informative. Approximately 55.4% of users stated advertising or not, 45.7% stated no and 45.7%
that they feel annoyed by online advertising. When stated that they trust online advertisements. When
asked to identity what is your favorite and least asked how comfortable are you about purchasing
favorite type of online advertisement out of the directly through an address or number listed in an
81