Page 81 - IILMGSM Journal_Management Perspective
P. 81
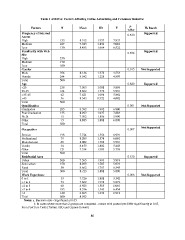
Table 1 ANOVA: Factors Affecting Online Advertising and Consumer Behavior
Factors N Mean SD F p- H0 Result
value Supported
Frequency of Internet 153 8.912 1.957 7.833 0.530
Access 227 7.943 1.856 5.001 Supported
High 130 8.485 1.664 6.822 0.556
Medium
Low 230 0.015 Not Supported
Familiarity with Web 170
Site 100 8.136 1.273 4.554 0.820 Supported
High 8.542 1.221 4.893
Medium 256 0.001 Not Supported
Low 244 7.563 1.001 5.893
Gender 500 8.862 1.772 5.991
Male 7.621 1.091 5.882
Female 238 8.543 0.922 4.002
Total 164
Age 62 8.592 1.992 6.900
<25 36 8.992 1.927 7.884
25-35 500 7.982 1.856 5.990
>35-45 8.885 1.881 6.898
>45 285
Total 125
Qualification 15
Graduation 75
Post Graduation 500
Ph.D.
Other 0.007 Not Supported
Total
Occupation
Service 198 7.724 1.556 6.991
Professional 79 8.205 1.578 6.001
Manufacturer 68 8.002 1.781 5.991
Trader 34 8.453 1.882 5.443
Other 121 7.534 1.989 5.776
Total 500
Residential Area 0.530 Supported
Urban 300 7.565 1.993 5.919
Semi urban 150 8.029 1.787 5.923
Rural 50 8.662 1.767 6.545
Total 500 8.723 1.881 5.890
Work Experience 0.006 Not Supported
0 to 1 35 7.726 1.881 5.342
>1 to 2 72 7.662 1.991 5.872
>2 to 3 68 8.923 1.565 6.001
>3 to 4 185 8.556 1.343 6.454
>4 140 8.665 1.676 6.912
Total 500 8.992
Notes: a. Decision rule - Significant at 0.05
b. In cases where more than 2 groups are compared - means with postscripts differ significantly at 0.05,
from Post Hoc Tests (Turkey HSD and Games-Howell)
80