
Steve Koerbers Q1 Report 2022
P. 1
STEVE KOERBER’S
Quarterly REPORT Remuera Grammar Zone - Q1 January | February | March 2022
RAY WHITE REMUERA | MEGAN JAFFE REAL ESTATE LTD (LICENSED REAA 2008)
MEXICAN STANDOFFS IN REMUERA ARE USUALLY SHORTLIVED
Following on from Remuera’s steepest ever median price increase last year (36.2%), it’s not surprising our local market has entered another cooling-off period.
Let’s face it, if prices had kept rising at that unsustainable pace, most Remuera homeowners would have seen their homes double within a 3 year period.
I started selling homes in Remuera in 1998, and ever since have observed that in Remuera a doubling every 7 to 10 years would be a more reasonable expectation.
Our market in 2022 has been relatively subdued
due to more buyers and sellers holding tight to their positions. As people wean off Covid restrictions and tighten their belts due to inflation, my forecast for
the coming quarter is that stock levels will drop and a growing number of buyers (boosted by Kiwis returning to Remuera from overseas and relaxed lending restrictions) will lament that there is “not much for sale”.
If you think fast price declines are possible in Remuera, think again. Time and time again I’ve witnessed similar temporary standoffs between buyers and sellers. When our suburb’s sellers hibernate for winter, buyers are often frustrated in two ways:
1. They can’t find a suitable home to buy, and
2. They compete and pay more, if and when they do find a suitable home.
Until next quarter, stay well.
Steve Koerber
P.S: Some companies are reporting circa 25% auction ‘under the hammer’ success rates. Nila and I have achieved twice that success rate so far in 2022.
Global Financial Crisis
Quarterly Report | Q1 2022
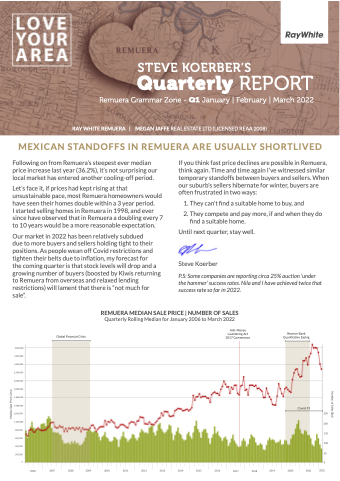
REMUERA | JANUARY 2006 T0 MARCH 2022
REMUQERuAartMerElyDRIAoNllinSgAMLEedPiRanICPEri|cNe U&MNBuEmRbeOrFoSf ASaLlEeSs Quarterly Rolling Median for January 2006 to March 2022
Anti-Money Laundering Act 2017 Commences
Reserve Bank Quantitative Easing
Covid-19
2,800,000 2,600,000 2,400,000 2,200,000 2,000,000 1,800,000 1,600,000 1,400,000 1,200,000 1,000,000 800,000 600,000 400,000 200,000
250 200 150 100 50
00
2006 2007 2008 2009 2010 2011 2012 2013 2014 2015 2016 2017 2018 2019 2020 2021 2022
Number of Sales (Bar)
Median Sale Price (Line)
