
Page 135 - B2 British council_Neat
P. 135
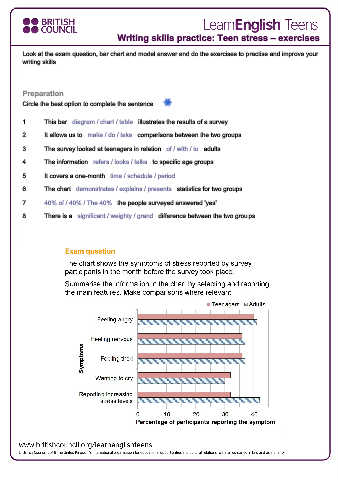
Writing skills practice: Teen stress – exercises


         Look at the exam question, bar chart and model answer and do the exercises to practise and improve your
         writing skills.


         Preparation
         Circle the best option to complete the sentence.


         1.      This bar   diagram / chart / table   illustrates the results of a survey.

         2.      It allows us to   make / do / take   comparisons between the two groups.

         3.      The survey looked at teenagers in relation   of / with / to   adults.

         4.      The information   refers / looks / talks   to specific age groups.

         5.      It covers a one-month   time / schedule / period   .

         6.      The chart   demonstrates / explains / presents   statistics for two groups.

         7.      40% of / 40% / The 40%   the people surveyed answered 'yes'.
         8.      There is a   significant / weighty / grand   difference between the two groups.