
Page 140 - B2 British council_Neat
P. 140
Writing skills practice: Writing about a bar chart – exercises
Look at the exam question and report and do the exercises to improve your writing skills.
Preparation
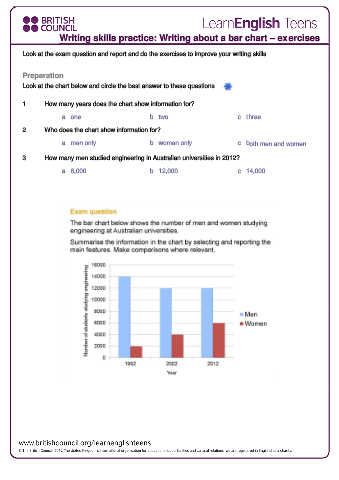
Look at the chart below and circle the best answer to these questions.
1. How many years does the chart show information for?
a. one b. two c. three
2. Who does the chart show information for?
a. men only b. women only c. both men and women
3. How many men studied engineering in Australian universities in 2012?
a. 6,000 b. 12,000 c. 14,000