
Page 9 - Centrik Brochure 2021/22
P. 9
Centrik Brochure You Have Control 09
RISK MODULE
Enable detailed predictive risk
management through a number of
methodologies. Answer key strategic
questions: Are you safe to operate?
What is your biggest risk? Is that
risk worsening or improving? Use
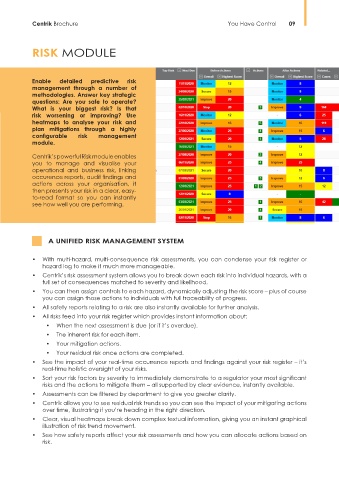
heatmaps to analyse your risk and
plan mitigations through a highly
configurable risk management
module.
Centrik’s powerful Risk module enables
you to manage and visualise your
operational and business risk, linking
occurence reports, audit findings and
actions across your organisation, it
then presents your risk in a clear, easy-
to-read format so you can instantly
see how well you are performing.
A UNIFIED RISK MANAGEMENT SYSTEM
• With multi-hazard, multi-consequence risk assessments, you can condense your risk register or
hazard log to make it much more manageable.
• Centrik’s risk assessment system allows you to break down each risk into individual hazards, with a
full set of consequences matched to severity and likelihood.
• You can then assign controls to each hazard, dynamically adjusting the risk score – plus of course
you can assign those actions to individuals with full traceability of progress.
• All safety reports relating to a risk are also instantly available for further analysis.
• All risks feed into your risk register which provides instant information about:
• When the next assessment is due (or if it’s overdue).
• The inherent risk for each item.
• Your mitigation actions.
• Your residual risk once actions are completed.
• See the impact of your real-time occurrence reports and findings against your risk register – it’s
real-time holistic oversight of your risks.
• Sort your risk factors by severity to immediately demonstrate to a regulator your most significant
risks and the actions to mitigate them – all supported by clear evidence, instantly available.
• Assessments can be filtered by department to give you greater clarity.
• Centrik allows you to see residual risk trends so you can see the impact of your mitigating actions
over time, illustrating if you’re heading in the right direction.
• Clear, visual heatmaps break down complex textual information, giving you an instant graphical
illustration of risk trend movement.
• See how safety reports affect your risk assessments and how you can allocate actions based on
risk.