
Page 110 - Data Science Algorithms in a Week
P. 110
Random Forest
Hot,None,Spring,No
Hot,Breeze,Autumn,Yes
Warm,Breeze,Spring,Yes
Cold,Breeze,Winter,No
Cold,None,Spring,Yes
Hot,Strong,Summer,Yes
Warm,None,Autumn,Yes
Warm,Strong,Spring,?
Output:
We construct four trees in a random forest:
$ python chess_with_seasons.csv 4 2 > chess_with_seasons.out
The whole construction and analysis is stored in the file
source_code/4/chess_with_seasons.out. Your construction may differ
because of the randomness involved. From the output we extract the random
forest graph consisting of random decision trees given the random numbers
generated during our run.
Executing the command above again will most likely result in a different output
and different random forest graph. Yet the results of the classification should be
similar with a high probability because of the multiplicity of the random decision
trees and their voting power combined. The classification by one random decision
tree may be subject to a great variance. However, the majority vote combines the
classification from all the trees, thus reducing the variance. To verify your
understanding, you can compare your results of the classification with the
classification by the random forest graph below.
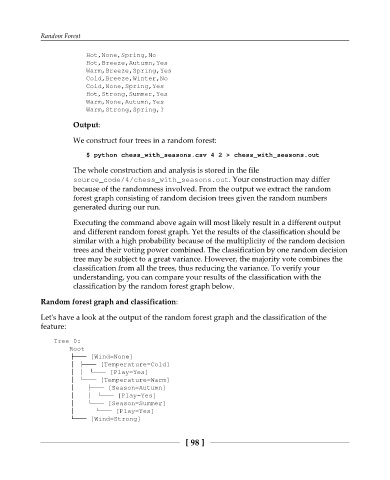
Random forest graph and classification:
Let's have a look at the output of the random forest graph and the classification of the
feature:
Tree 0:
Root
├── [Wind=None]
│ ├── [Temperature=Cold]
│ │ └── [Play=Yes]
│ └── [Temperature=Warm]
│ ├── [Season=Autumn]
│ │ └── [Play=Yes]
│ └── [Season=Summer]
│ └── [Play=Yes]
└── [Wind=Strong]
[ 98 ]