
Page 130 - Data Science Algorithms in a Week
P. 130
Clustering into K Clusters
Now the red cluster where Peter belongs has changed. What is the proportion of the house
owners in the red cluster now? If we do not count Peter, 2/3 of people in the red cluster own
a house. When we clustered into the 2 or 3 clusters, the proportion was only ½ which did
not tell us about the prediction of whether Peter is a house-owner or not. Now there is a
majority of house owners in the red cluster not counting Peter, so we have a higher belief
that Peter should also be a house owner. However, 2/3 is still a relatively low confidence for
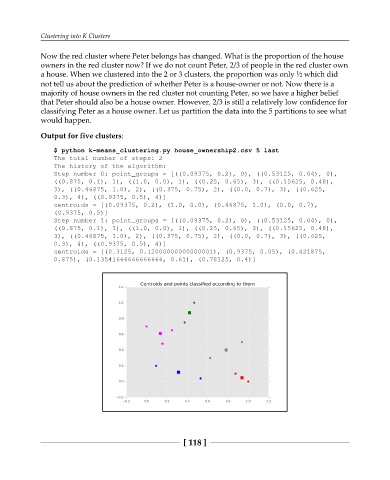
classifying Peter as a house owner. Let us partition the data into the 5 partitions to see what
would happen.
Output for five clusters:
$ python k-means_clustering.py house_ownership2.csv 5 last
The total number of steps: 2
The history of the algorithm:
Step number 0: point_groups = [((0.09375, 0.2), 0), ((0.53125, 0.04), 0),
((0.875, 0.1), 1), ((1.0, 0.0), 1), ((0.25, 0.65), 3), ((0.15625, 0.48),
3), ((0.46875, 1.0), 2), ((0.375, 0.75), 2), ((0.0, 0.7), 3), ((0.625,
0.3), 4), ((0.9375, 0.5), 4)]
centroids = [(0.09375, 0.2), (1.0, 0.0), (0.46875, 1.0), (0.0, 0.7),
(0.9375, 0.5)]
Step number 1: point_groups = [((0.09375, 0.2), 0), ((0.53125, 0.04), 0),
((0.875, 0.1), 1), ((1.0, 0.0), 1), ((0.25, 0.65), 3), ((0.15625, 0.48),
3), ((0.46875, 1.0), 2), ((0.375, 0.75), 2), ((0.0, 0.7), 3), ((0.625,
0.3), 4), ((0.9375, 0.5), 4)]
centroids = [(0.3125, 0.12000000000000001), (0.9375, 0.05), (0.421875,
0.875), (0.13541666666666666, 0.61), (0.78125, 0.4)]
[ 118 ]