
Page 228 - Data Science Algorithms in a Week
P. 228
212 Abdulrahman Albar, Ahmad Elshennawy, Mohammed Basingab et al.
Table 6 details the data used in the membership functions of subsystem III, where
both trapezoidal and triangular membership functions are used across the three inputs and
one output. It should be noted again that the output of subsystem II, ED staffing, is an
input in subsystem III, dictating the use of a trapezoidal membership function for this
subsystem’s associated input. As this input shares the same membership function
characteristics as previously described, it will be omitted in the description of this
subsystem’s membership functions. While the populations for patient complexity input
are separate between this subsystem and subsystem I, the membership functions share the
same characteristics, and thus the membership functions for patient complexity will not
be discussed in this subsystem as well.
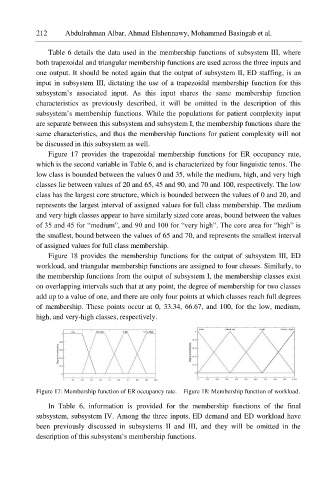
Figure 17 provides the trapezoidal membership functions for ER occupancy rate,
which is the second variable in Table 6, and is characterized by four linguistic terms. The
low class is bounded between the values 0 and 35, while the medium, high, and very high
classes lie between values of 20 and 65, 45 and 90, and 70 and 100, respectively. The low
class has the largest core structure, which is bounded between the values of 0 and 20, and
represents the largest interval of assigned values for full class membership. The medium
and very high classes appear to have similarly sized core areas, bound between the values
of 35 and 45 for “medium”, and 90 and 100 for “very high”. The core area for “high” is
the smallest, bound between the values of 65 and 70, and represents the smallest interval
of assigned values for full class membership.
Figure 18 provides the membership functions for the output of subsystem III, ED
workload, and triangular membership functions are assigned to four classes. Similarly, to
the membership functions from the output of subsystem I, the membership classes exist
on overlapping intervals such that at any point, the degree of membership for two classes
add up to a value of one, and there are only four points at which classes reach full degrees
of membership. These points occur at 0, 33.34, 66.67, and 100, for the low, medium,
high, and very-high classes, respectively.
Figure 17: Membership function of ER occupancy rate. Figure 18: Membership function of workload.
In Table 6, information is provided for the membership functions of the final
subsystem, subsystem IV. Among the three inputs, ED demand and ED workload have
been previously discussed in subsystems II and III, and they will be omitted in the
description of this subsystem’s membership functions.