
Page 32 - Banking Finance January 2018
P. 32
ARTICLE
Table -1 Number of cases referred and amount recovered
(Rs billion)
Year Recovery channel LokAdalat DRT SARFAESI Total
2012-13 Number of cases referred 8,40,691 13,408 1,90,537 10,44,636
Amount involved 66 310 681 1057
Amount recovered@ 4 44 185 233
% of Recovery 6.1 14.1 27.1 21.9
2013-14 Number of cases referred 16,36,957 28,258 1,94,707 18,59,922
Amount involved 232 553 953 1,738
Amount recovered @ 14 53 253 320
% of Recovery 6.2 9.5 26.6 18.4
2014-15 Number of cases referred 91,31,199 1,71,113 12,41,086 105,43,398
Amount involved 887 3,789 4,705 9,381
Amount recovered @ 43 531 1,152 1,726
% of Recovery 4.8 14 24.5 18.4
Source : BSR Statistics -RBI
@Refer to amount recovered during the given year , which could be with reference to cases referred during the given
year as well as during the earlier years
A look at the above data shows the speed with which courts cases settled through any of the three available legal
have responded to closing the bad debt cases referred to options of recovery of bad loans to banks has been on the
them . The loans recovered through judicial processes are decline. The amount involved shows an alarming trend
below the recovery under SARFAESI.The much touted recov- (Graph-1 ) The gross NPA recovery rate under these legal
ery mechanism through the SARFAESI Act has not even process shows only at 18.4 % ( Graph-2 ).The annual re-
touched 25 % during 2014-15.Its decline year after year is covery as percentage of amount of cases filed under
more alarming .The number of cases referred to courts SARFAESI Act, with DRT and LokAdalat ,further fell to 9%
increased tenfold between 2012 and 2015 .The number of in 2015-16.The amount involved in legal process of recov-
ery is nowhere near the amount of
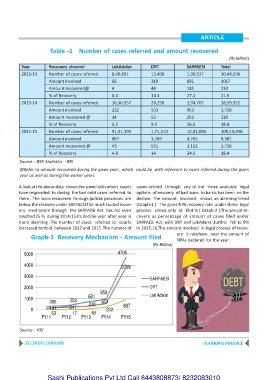
Graph-1 Recovery Mechanism - Amount filed
NPAs declared for the year .
(Rs Billion)
Source : RBI
32 | 2018 | JANUARY | BANKING FINANCE
Sashi Publications Pvt Ltd Call 8443808873/ 8232083010