Page 54 - Insurance Times April 2017 Special Issue on Newindia
P. 54

Statistics


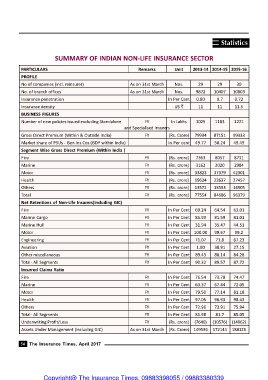
                         SUMMARY OF INDIAN NON-LIFE INSURANCE SECTOR


           PARTICULARS                                         Remarks         Unit    2013-14 2014-15 2015-16
           PROFILE
           No of companies (incl. reinsurer)               As on 31st March    Nos.      29       29      30
           No. of branch offices                           As on 31st March    Nos.     9872    10407    10803
           Insurance penetration                                            In Per Cent  0.80    0.7     0.72
           Insurance density                                                   US $      11       11     11.5
           BUSINESS FIGURES
           Number of new policies issued excluding Standalone    FY          In Lakhs   1025     1183    1221
                                                        and Specialised Insurers
           Gross Direct Premium (Within & Outside India)         FY         (Rs. Crore)  79934  87151    99333
           Market share of PSUs - Gen.Ins.Cos.(GDP within India)            In Per cent  49.77  50.24    49.49
           Segment Wise Gross Direct Premium (Within India )
           Fire                                                  FY         (Rs. crore)  7363    8057    8731
           Marine                                                FY         (Rs. crore)  3162    3020    2984
           Motor                                                 FY         (Rs. crore)  33823  37379    42301
           Health                                                FY         (Rs. crore)  19634  22637    27457
           Others                                                FY         (Rs. crore)  13572  13593    14905

           Total                                                 FY         (Rs. crore)  77554  84686    96379
           Net Retentions of Non-Life Insurers(including GIC)
           Fire                                                  FY         In Per Cent  69.24  64.54    63.01
           Marine Cargo                                          FY         In Per Cent  85.99  81.59    81.01
           Marine Hull                                           FY         In Per Cent  31.94  35.47    44.51
           Motor                                                 FY         In Per Cent 100.00  99.67    99.2
           Engineering                                           FY         In Per Cent  71.07   71.8    67.23
           Aviation                                              FY         In Per Cent  1.00   38.91    27.15
           Other miscellaneous                                   FY         In Per Cent  89.43  88.14    84.28
           Total- All Segments                                   FY         In Per Cent  90.32  89.57    87.72
           Incurred Claims Ratio
           Fire                                                  FY         In Per Cent  76.54  73.78    74.47
           Marine                                                FY         In Per Cent  63.37  67.44    72.05
           Motor                                                 FY         In Per Cent  79.50  77.14    81.18
           Health                                                FY         In Per Cent  97.05  96.93    98.43
           Others                                                FY         In Per Cent  72.96  73.91    75.94
           Total- All Segments                                   FY         In Per Cent  81.98   81.7    85.05

           Underwriting Profit/Loss                              FY         (Rs. crore)  (7640)  (10576) (14962)
           Assets Under Management (including GIC)         As on 31st March  (Rs. Crore) 149536  172144  188126


          54  The Insurance Times, April 2017


                    Copyright@ The Insurance Times. 09883398055 / 09883380339
   49   50   51   52   53   54   55   56   57   58   59