
Page 55 - Banking Finance November 2022
P. 55
STATISTICS
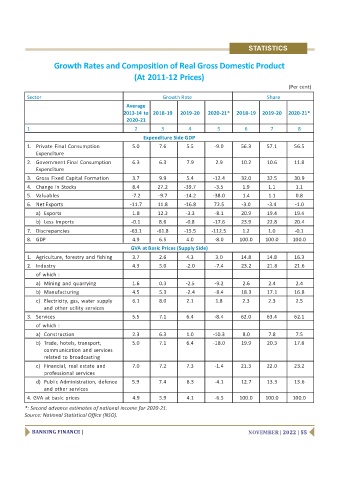
Growth Rates and Composition of Real Gross Domestic Product
(At 2011-12 Prices)
(Per cent)
Sector Growth Rate Share
Average
2013-14 to 2018-19 2019-20 2020-21* 2018-19 2019-20 2020-21*
2020-21
1 2 3 4 5 6 7 8
Expenditure Side GDP
1. Private Final Consumption 5.0 7.6 5.5 -9.0 56.3 57.1 56.5
Expenditure
2. Government Final Consumption 6.3 6.3 7.9 2.9 10.2 10.6 11.8
Expenditure
3. Gross Fixed Capital Formation 3.7 9.9 5.4 -12.4 32.0 32.5 30.9
4. Change in Stocks 8.4 27.2 -39.7 -3.5 1.9 1.1 1.1
5. Valuables -7.2 -9.7 -14.2 -38.0 1.4 1.1 0.8
6. Net Exports -11.7 11.8 -16.8 72.5 -3.0 -3.4 -1.0
a) Exports 1.8 12.3 -3.3 -8.1 20.9 19.4 19.4
b) Less Imports -0.1 8.6 -0.8 -17.6 23.9 22.8 20.4
7. Discrepancies -63.1 -61.8 -15.5 -112.5 1.2 1.0 -0.1
8. GDP 4.9 6.5 4.0 -8.0 100.0 100.0 100.0
GVA at Basic Prices (Supply Side)
1. Agriculture, forestry and fishing 3.7 2.6 4.3 3.0 14.8 14.8 16.3
2. Industry 4.3 5.0 -2.0 -7.4 23.2 21.8 21.6
of which :
a) Mining and quarrying 1.6 0.3 -2.5 -9.2 2.6 2.4 2.4
b) Manufacturing 4.5 5.3 -2.4 -8.4 18.3 17.1 16.8
c) Electricity, gas, water supply 6.1 8.0 2.1 1.8 2.3 2.3 2.5
and other utility services
3. Services 5.5 7.1 6.4 -8.4 62.0 63.4 62.1
of which :
a) Construction 2.3 6.3 1.0 -10.3 8.0 7.8 7.5
b) Trade, hotels, transport, 5.0 7.1 6.4 -18.0 19.9 20.3 17.8
communication and services
related to broadcasting
c) Financial, real estate and 7.0 7.2 7.3 -1.4 21.3 22.0 23.2
professional services
d) Public Administration, defence 5.9 7.4 8.3 -4.1 12.7 13.3 13.6
and other services
4. GVA at basic prices 4.9 5.9 4.1 -6.5 100.0 100.0 100.0
*: Second advance estimates of national income for 2020-21.
Source: National Statistical Office (NSO).
BANKING FINANCE | NOVEMBER | 2022 | 55