
Page 55 - Banking Finance October 2019
P. 55
STATISTICS
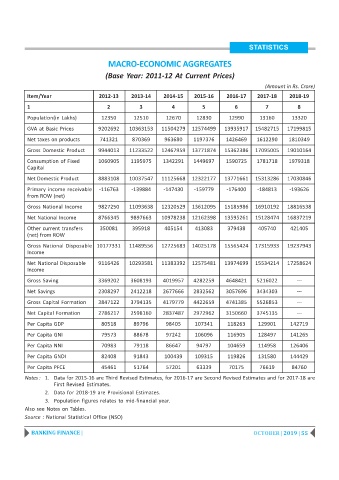
MACRO-ECONOMIC AGGREGATES
(Base Year: 2011-12 At Current Prices)
(Amount in Rs. Crore)
Item/Year 2012-13 2013-14 2014-15 2015-16 2016-17 2017-18 2018-19
1 2 3 4 5 6 7 8
Population(in Lakhs) 12350 12510 12670 12830 12990 13160 13320
GVA at Basic Prices 9202692 10363153 11504279 12574499 13935917 15482715 17199815
Net taxes on products 741321 870369 963680 1197376 1426469 1612290 1810349
Gross Domestic Product 9944013 11233522 12467959 13771874 15362386 17095005 19010164
Consumption of Fixed 1060905 1195975 1342291 1449697 1590725 1781718 1979318
Capital
Net Domestic Product 8883108 10037547 11125668 12322177 13771661 15313286 17030846
Primary income receivable -116763 -139884 -147430 -159779 -176400 -184813 -193626
from ROW (net)
Gross National Income 9827250 11093638 12320529 13612095 15185986 16910192 18816538
Net National Income 8766345 9897663 10978238 12162398 13595261 15128474 16837219
Other current transfers 350081 395918 405154 413083 379438 405740 421405
(net) from ROW
Gross National Disposable 10177331 11489556 12725683 14025178 15565424 17315933 19237943
Income
Net National Disposable 9116426 10293581 11383392 12575481 13974699 15534214 17258624
Income
Gross Saving 3369202 3608193 4019957 4282259 4648421 5216022 ---
Net Savings 2308297 2412218 2677666 2832562 3057696 3434303 ---
Gross Capital Formation 3847122 3794135 4179779 4422659 4741385 5526853 ---
Net Capital Formation 2786217 2598160 2837487 2972962 3150660 3745135 ---
Per Capita GDP 80518 89796 98405 107341 118263 129901 142719
Per Capita GNI 79573 88678 97242 106096 116905 128497 141265
Per Capita NNI 70983 79118 86647 94797 104659 114958 126406
Per Capita GNDI 82408 91843 100439 109315 119826 131580 144429
Per Capita PFCE 45461 51764 57201 63339 70175 76619 84760
Notes : 1. Data for 2015-16 are Third Revised Estimates, for 2016-17 are Second Revised Estimates and for 2017-18 are
First Revised Estimates.
2. Data for 2018-19 are Provisional Estimates.
3. Population figures relates to mid-financial year.
Also see Notes on Tables.
Source : National Statistical Office (NSO)
BANKING FINANCE | OCTOBER | 2019 | 55