
Page 56 - Banking Finance October 2019
P. 56
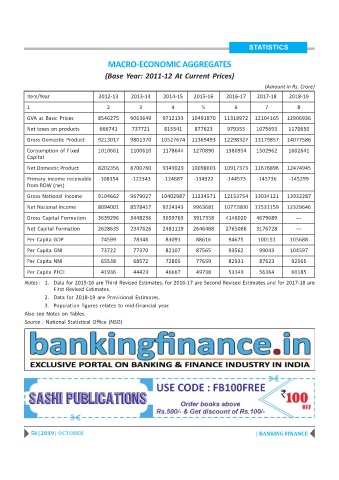
STATISTICS

                                       MACRO-ECONOMIC AGGREGATES

                                      (Base Year: 2011-12 At Current Prices)
                                                                                              (Amount in Rs. Crore)

          Item/Year                 2012-13    2013-14    2014-15    2015-16    2016-17    2017-18     2018-19
          1                            2          3          4          5          6          7          8
          GVA at Basic Prices      8546275     9063649    9712133   10491870    11318972   12104165   12906936

          Net taxes on products     666741     737721      815541    877623      979355    1075693    1170650
          Gross Domestic Product   9213017     9801370    10527674  11369493    12298327   13179857   14077586
          Consumption of Fixed     1010661     1100610    1178644    1270890    1380954    1502962    1602641
          Capital
          Net Domestic Product     8202356     8700760    9349029   10098603    10917373   11676896   12474945

          Primary income receivable  -108354   -122343    -124687    -134922    -144573    -145736     -145299
          from ROW (net)
          Gross National Income    9104662     9679027    10402987  11234571    12153754   13034121   13932287

          Net National Income      8094001     8578417    9224343    9963681    10772800  11531159    12329646
          Gross Capital Formation  3639296     3448236    3659763    3917358    4146020    4679689       ---

          Net Capital Formation    2628635     2347626    2481119    2646468    2765066    3176728       ---
          Per Capita GDP            74599       78348      83091      88616      94675      100151     105688
          Per Capita GNI            73722       77370      82107      87565      93562      99043      104597

          Per Capita NNI            65538       68572      72805      77659      82931      87623      92565
          Per Capita PFCE           41936       44423      46667      49738      53149      56364      60185
          Notes : 1. Data for 2015-16 are Third Revised Estimates, for 2016-17 are Second Revised Estimates and for 2017-18 are
                    First Revised Estimates.
                 2. Data for 2018-19 are Provisional Estimates.
                 3. Population figures relates to mid-financial year.
          Also see Notes on Tables.
          Source : National Statistical Office (NSO)


            56 | 2019 | OCTOBER                                                            | BANKING FINANCE