
Page 55 - Banking Finance August 2019
P. 55
STATISTICS
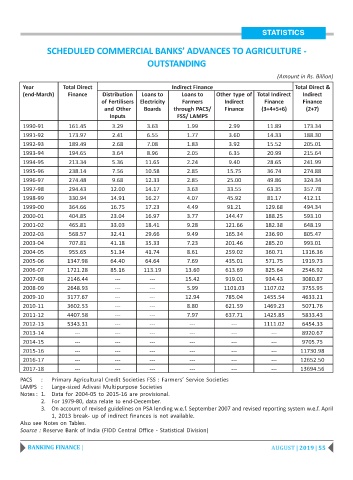
SCHEDULED COMMERCIAL BANKS’ ADVANCES TO AGRICULTURE -
OUTSTANDING
(Amount in Rs. Billion)
Year Total Direct Indirect Finance Total Direct &
(end-March) Finance Distribution Loans to Loans to Other type of Total Indirect Indirect
of Fertilisers Electricity Farmers Indirect Finance Finance
and Other Boards through PACS/ Finance (3+4+5+6) (2+7)
Inputs FSS/ LAMPS
1990-91 161.45 3.29 3.63 1.99 2.99 11.89 173.34
1991-92 173.97 2.41 6.55 1.77 3.60 14.33 188.30
1992-93 189.49 2.68 7.08 1.83 3.92 15.52 205.01
1993-94 194.65 3.64 8.96 2.05 6.35 20.99 215.64
1994-95 213.34 5.36 11.65 2.24 9.40 28.65 241.99
1995-96 238.14 7.56 10.58 2.85 15.75 36.74 274.88
1996-97 274.48 9.68 12.33 2.85 25.00 49.86 324.34
1997-98 294.43 12.00 14.17 3.63 33.55 63.35 357.78
1998-99 330.94 14.91 16.27 4.07 45.92 81.17 412.11
1999-00 364.66 16.75 17.23 4.49 91.21 129.68 494.34
2000-01 404.85 23.04 16.97 3.77 144.47 188.25 593.10
2001-02 465.81 33.03 18.41 9.28 121.66 182.38 648.19
2002-03 568.57 32.41 29.66 9.49 165.34 236.90 805.47
2003-04 707.81 41.18 35.33 7.23 201.46 285.20 993.01
2004-05 955.65 51.34 41.74 8.61 259.02 360.71 1316.36
2005-06 1347.98 64.40 64.64 7.69 435.01 571.75 1919.73
2006-07 1721.28 85.16 113.19 13.60 613.69 825.64 2546.92
2007-08 2146.44 --- --- 15.42 919.01 934.43 3080.87
2008-09 2648.93 --- --- 5.99 1101.03 1107.02 3755.95
2009-10 3177.67 --- --- 12.94 785.04 1455.54 4633.21
2010-11 3602.53 --- --- 8.80 621.59 1469.23 5071.76
2011-12 4407.58 --- --- 7.97 637.71 1425.85 5833.43
2012-13 5343.31 --- --- --- --- 1111.02 6454.33
2013-14 --- --- --- --- --- --- 8920.67
2014-15 --- --- --- --- --- --- 9705.75
2015-16 --- --- --- --- --- --- 11730.98
2016-17 --- --- --- --- --- --- 12652.50
2017-18 --- --- --- --- --- --- 13694.56
PACS : Primary Agricultural Credit Societies FSS : Farmers’ Service Societies
LAMPS : Large-sized Adivasi Multipurpose Societies
Notes : 1. Data for 2004-05 to 2015-16 are provisional.
2. For 1979-80, data relate to end-December.
3. On account of revised guidelines on PSA lending w.e.f. September 2007 and revised reporting system w.e.f. April
1, 2013 break- up of indirect finances is not available.
Also see Notes on Tables.
Source : Reserve Bank of India (FIDD Central Office - Statistical Division)
BANKING FINANCE | AUGUST | 2019 | 55