
Page 54 - Operations Strategy
P. 54
WHAT is THE ‘COnTEnT’ Of OPERATiOns sTRATEgy? 29
measures so that we can understand how it is built up. The best-known examples of this
occur in financial accounting. Here we will do it in a slightly different way by insert-
ing measures that have some meaning in an operations context. We are not proposing
this ratio analysis as a practical analysis tool. Rather, it is intended to provide some
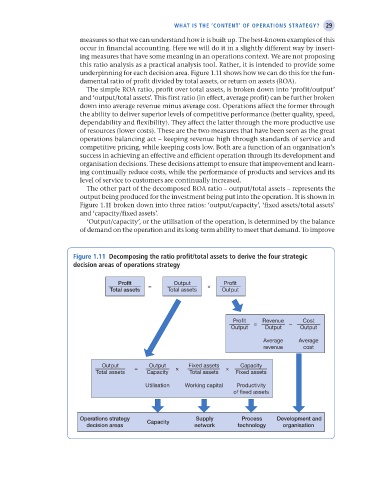
underpinning for each decision area. Figure 1.11 shows how we can do this for the fun-
damental ratio of profit divided by total assets, or return on assets (ROA).
The simple ROA ratio, profit over total assets, is broken down into ‘profit/output’
and ‘output/total assets’. This first ratio (in effect, average profit) can be further broken
down into average revenue minus average cost. Operations affect the former through
the ability to deliver superior levels of competitive performance (better quality, speed,
dependability and flexibility). They affect the latter through the more productive use
of resources (lower costs). These are the two measures that have been seen as the great
operations balancing act – keeping revenue high through standards of service and
competitive pricing, while keeping costs low. Both are a function of an organisation’s
success in achieving an effective and efficient operation through its development and
organisation decisions. These decisions attempt to ensure that improvement and learn-
ing continually reduce costs, while the performance of products and services and its
level of service to customers are continually increased.
The other part of the decomposed ROA ratio – output/total assets – represents the
output being produced for the investment being put into the operation. It is shown in
Figure 1.11 broken down into three ratios: ‘output/capacity’, ‘fixed assets/total assets’
and ‘capacity/fixed assets’.
‘Output/capacity’, or the utilisation of the operation, is determined by the balance
of demand on the operation and its long-term ability to meet that demand. To improve
Figure 1.11 Decomposing the ratio profit/total assets to derive the four strategic
decision areas of operations strategy
Profit = Output × Profit
Total assets Total assets Output
Profit Revenue Cost
Output = Output – Output
Average Average
revenue cost
Output Output Fixed assets Capacity
Total assets = Capacity × Total assets × Fixed assets
Utilisation Working capital Productivity
of fixed assets
Operations strategy Capacity Supply Process Development and
decision areas network technology organisation
M01 Operations Strategy 62492.indd 29 02/03/2017 13:00