
Page 114 - Libro 2
P. 114
94
PART 2 — CEREBROVASCULAR
Doppler signals by providing a kind of color road map. Exceptions to this are color or power Doppler signals supporting identification of anomalous ves- sels and B-mode providing evidence of brain mid- line shifts and the visualization of masses. M-mode captures high intensity transient signals representing emboli. Documentation will vary according to the type of study being performed and will be discussed for each application later in the chapter.
The intracranial arteries are a continuation of the cervical internal and vertebral arteries and, as such, examining them in a proximal to distal order will facilitate interpretation. Spectral Doppler waveforms from each of the listed arterial segments from the right and left cerebral hemispheres and posterior cir- culation constitute a complete study.7 When patholo- gy is present, additional waveforms may be required to demonstrate abnormal flow characteristics.
Limited TCDs may be done for a number of rea- sons, such as repeat exams of affected vessels only, in acute stroke when using a fast protocol to deter- mine single vessel patency,8 when monitoring for microemboli, or when monitoring during an inter- vention. Required documentation will depend on the specifics of the study, why it was ordered, and which arteries are of interest. At a minimum, one spec- tral waveform from each artery or arterial segment studied is documented in normal exams or multiple waveforms to demonstrate the pathologies that are required for an adequate interpretation to be made.
Spectral Doppler Characteristics
Acquisition of a good spectral Doppler wave- form from each required segment is essential as
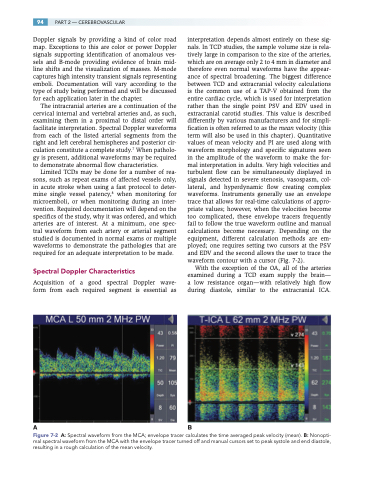
interpretation depends almost entirely on these sig- nals. In TCD studies, the sample volume size is rela- tively large in comparison to the size of the arteries, which are on average only 2 to 4 mm in diameter and therefore even normal waveforms have the appear- ance of spectral broadening. The biggest difference between TCD and extracranial velocity calculations is the common use of a TAP-V obtained from the entire cardiac cycle, which is used for interpretation rather than the single point PSV and EDV used in extracranial carotid studies. This value is described differently by various manufacturers and for simpli- fication is often referred to as the mean velocity (this term will also be used in this chapter). Quantitative values of mean velocity and PI are used along with waveform morphology and specific signatures seen in the amplitude of the waveform to make the for- mal interpretation in adults. Very high velocities and turbulent flow can be simultaneously displayed in signals detected in severe stenosis, vasospasm, col- lateral, and hyperdynamic flow creating complex waveforms. Instruments generally use an envelope trace that allows for real-time calculations of appro- priate values; however, when the velocities become too complicated, these envelope tracers frequently fail to follow the true waveform outline and manual calculations become necessary. Depending on the equipment, different calculation methods are em- ployed; one requires setting two cursors at the PSV and EDV and the second allows the user to trace the waveform contour with a cursor (Fig. 7-2).
With the exception of the OA, all of the arteries examined during a TCD exam supply the brain— a low resistance organ—with relatively high flow during diastole, similar to the extracranial ICA.
AB
Figure 7-2 A: Spectral waveform from the MCA; envelope tracer calculates the time averaged peak velocity (mean). B: Nonopti- mal spectral waveform from the MCA with the envelope tracer turned off and manual cursors set to peak systole and end diastole, resulting in a rough calculation of the mean velocity.
