
Page 151 - Libro 2
P. 151
8 — Indirect Assessment of Arterial Disease
131
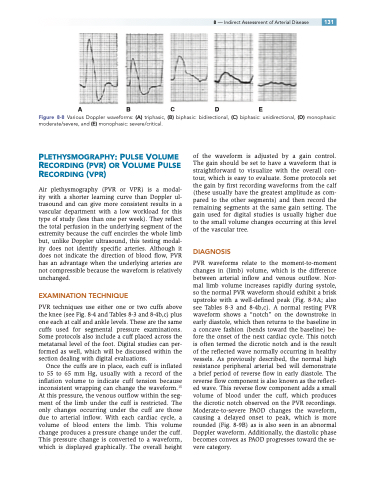
ABCDE
Figure 8-8 Various Doppler waveforms: (A) triphasic, (B) biphasic: bidirectional, (C) biphasic: unidirectional, (D) monophasic: moderate/severe, and (E) monophasic: severe/critical.
PLETHYSMOGRAPHY: PULSE VOLUME RECORDING (PVR) OR VOLUME PULSE RECORDING (VPR)
Air plethysmography (PVR or VPR) is a modal- ity with a shorter learning curve than Doppler ul- trasound and can give more consistent results in a vascular department with a low workload for this type of study (less than one per week). They reflect the total perfusion in the underlying segment of the extremity because the cuff encircles the whole limb but, unlike Doppler ultrasound, this testing modal- ity does not identify specific arteries. Although it does not indicate the direction of blood flow, PVR has an advantage when the underlying arteries are not compressible because the waveform is relatively unchanged.
EXAMINATION TECHNIQUE
PVR techniques use either one or two cuffs above the knee (see Fig. 8-4 and Tables 8-3 and 8-4b,c) plus one each at calf and ankle levels. These are the same cuffs used for segmental pressure examinations. Some protocols also include a cuff placed across the metatarsal level of the foot. Digital studies can per- formed as well, which will be discussed within the section dealing with digital evaluations.
Once the cuffs are in place, each cuff is inflated to 55 to 65 mm Hg, usually with a record of the inflation volume to indicate cuff tension because inconsistent wrapping can change the waveform.15 At this pressure, the venous outflow within the seg- ment of the limb under the cuff is restricted. The only changes occurring under the cuff are those due to arterial inflow. With each cardiac cycle, a volume of blood enters the limb. This volume change produces a pressure change under the cuff. This pressure change is converted to a waveform, which is displayed graphically. The overall height
of the waveform is adjusted by a gain control. The gain should be set to have a waveform that is straightforward to visualize with the overall con- tour, which is easy to evaluate. Some protocols set the gain by first recording waveforms from the calf (these usually have the greatest amplitude as com- pared to the other segments) and then record the remaining segments at the same gain setting. The gain used for digital studies is usually higher due to the small volume changes occurring at this level of the vascular tree.
DIAGNOSIS
PVR waveforms relate to the moment-to-moment changes in (limb) volume, which is the difference between arterial inflow and venous outflow. Nor- mal limb volume increases rapidly during systole, so the normal PVR waveform should exhibit a brisk upstroke with a well-defined peak (Fig. 8-9A; also see Tables 8-3 and 8-4b,c). A normal resting PVR waveform shows a “notch” on the downstroke in early diastole, which then returns to the baseline in a concave fashion (bends toward the baseline) be- fore the onset of the next cardiac cycle. This notch is often termed the dicrotic notch and is the result of the reflected wave normally occurring in healthy vessels. As previously described, the normal high resistance peripheral arterial bed will demonstrate a brief period of reverse flow in early diastole. The reverse flow component is also known as the reflect- ed wave. This reverse flow component adds a small volume of blood under the cuff, which produces the dicrotic notch observed on the PVR recordings. Moderate-to-severe PAOD changes the waveform, causing a delayed onset to peak, which is more rounded (Fig. 8-9B) as is also seen in an abnormal Doppler waveform. Additionally, the diastolic phase becomes convex as PAOD progresses toward the se- vere category.
