
Page 441 - Libro 2
P. 441
28 — Quality Assurance Statistics
421
based on the sonographer’s findings alone. However, in the early 1980s when duplex ultrasound was first used to assess the presence or absence of DVT, ultra- sound studies were in almost every case followed up by a venogram. After time, the consistency of accu- racy and reliability of duplex ultrasound to identify or rule out DVT eventually led to the virtual end of veno- grams. Using duplex ultrasound to rule out DVT is said to have good specificity. Specificity is the ability of a test to identify something as normal. It is calculated by dividing the number of true negative results by all the negative results as identified by the gold standard.
RELIABILITY
Reliability is the consistency of obtaining similar re- sults under similar circumstances. In a sense, it is accuracy over a period of time. A laboratory or ultra- sound department is reliable when the results of the tests produced are consistently accurate. Once the medical community determines that a department produces reliable results on a consistent basis, confi- dence in the department is ensured.
POSITIVE PREDICTIVE VALUE
The positive predictive value (PPV) is the proportion of patients with positive test results that are correctly identified. It is an important measure of a diagnostic method, such as ultrasound, that provides the proba- bility that a positive test reflects the underlying disease for which the test is being conducted. In other words, of all the positive venous studies in a department, the PPV is the percentage that correctly predicted a DVT based on the gold standard. This is calculated as the number of true positive studies divided by all the posi- tive studies (true positives plus false positives).
NEGATIVE PREDICTIVE VALUE
The negative predictive value (NPV) is the proportion of negative test results when there is no underlying disease present. It is an important measure of a diag- nostic method, such as ultrasound, that provides the probability that a negative test reflects the absence of disease. If this test states that there is no arterial obstruction of the arteries in the lower extremity, one can be confident that there is no disease present if the negative predictive value is high.1
THE CHI-SQUARE TEST
The chi-square (pronounced “kye” as in sky) is a statistical test that, in sum, compares the difference between what you “expect” and what you actually “observe.”2 If velocities meet a criteria of 50% to 79%, that is what you would expect to see on the
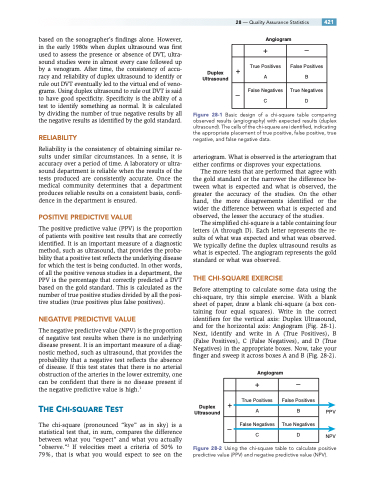
Angiogram
+
–
+
True Positives A
False Positives B
–
False Negatives C
True Negatives D
Duplex Ultrasound
Figure 28-1 Basic design of a chi-square table comparing observed results (angiography) with expected results (duplex ultrasound). The cells of the chi-square are identified, indicating the appropriate placement of true positive, false positive, true negative, and false negative data.
arteriogram. What is observed is the arteriogram that either confirms or disproves your expectations.
The more tests that are performed that agree with the gold standard or the narrower the difference be- tween what is expected and what is observed, the greater the accuracy of the studies. On the other hand, the more disagreements identified or the wider the difference between what is expected and observed, the lesser the accuracy of the studies.
The simplified chi-square is a table containing four letters (A through D). Each letter represents the re- sults of what was expected and what was observed. We typically define the duplex ultrasound results as what is expected. The angiogram represents the gold standard or what was observed.
THE CHI-SQUARE EXERCISE
Before attempting to calculate some data using the chi-square, try this simple exercise. With a blank sheet of paper, draw a blank chi-square (a box con- taining four equal squares). Write in the correct identifiers for the vertical axis: Duplex Ultrasound, and for the horizontal axis: Angiogram (Fig. 28-1). Next, identify and write in A (True Positives), B (False Positives), C (False Negatives), and D (True Negatives) in the appropriate boxes. Now, take your finger and sweep it across boxes A and B (Fig. 28-2).
Angiogram
+
–
+
True Positives
False Positives
A
B
–
False Negatives
True Negatives
C
D
Duplex Ultrasound
PPV
NPV
Figure 28-2 Using the chi-square table to calculate positive predictive value (PPV) and negative predictive value (NPV).
