
Page 443 - Libro 2
P. 443
28 — Quality Assurance Statistics
423
STATISTICS QUIZ
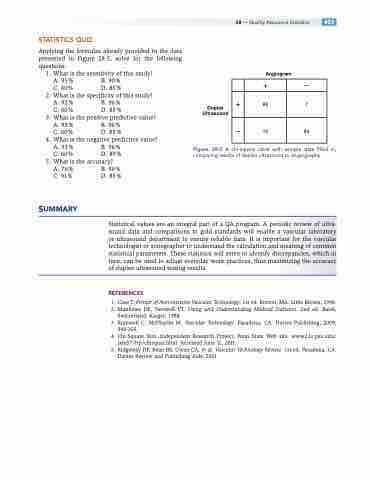
Applying the presented in questions.
1. What is A. 95% C. 60%
2. What is A. 92% C. 60%
3. What is A. 93% C. 60%
4. What is A. 33% C. 60%
5. What is A. 76%
C. 91%
SUMMARY
formulas already provided to the data Figure 28-5, solve for the following
the sensitivity of this study? B. 90%
D. 85%
the specificity of this study?
B. 96%
D. 85%
the positive predictive value?
B. 96%
D. 85%
the negative predictive value?
B. 96%
D. 89% the accuracy?
B. 96% D. 85%
Angiogram
+
–
+
88
7
–
10
84
Duplex Ultrasound
Figure 28-5 A chi-square table with sample data filled in, comparing results of duplex ultrasound to angiography.
Statistical values are an integral part of a QA program. A periodic review of ultra- sound data and comparisons to gold standards will enable a vascular laboratory or ultrasound department to ensure reliable data. It is important for the vascular technologist or sonographer to understand the calculation and meaning of common statistical parameters. These statistics will serve to identify discrepancies, which in turn, can be used to adjust everyday work practices, thus maximizing the accuracy of duplex ultrasound testing results.
REFERENCES
1. Case T. Primer of Non-invasive Vascular Technology. 1st ed. Boston, MA: Little Brown; 1996.
2. Matthews DE, Farewell VT. Using and Understanding Medical Statistics. 2nd ed. Basel,
Switzerland: Karger; 1988.
3. Rumwell C, McPharlin M. Vascular Technology. Pasadena, CA: Davies Publishing, 2009;
349-355.
4. Chi-Square Test. Independent Research Project, Penn State Web site. www2.lv.psu.edu/
jxm57/irp/chisquar.html. Accessed June 11, 2011.
5. Ridgeway DP, Bean BS, Owen CA, et al. Vascular Technology Review. 1st ed. Pasadena, CA:
Davies Review and Publishing Aids; 2001.
