
Page 442 - Libro 2
P. 442
422 PART 6 — MISCELLANEOUS
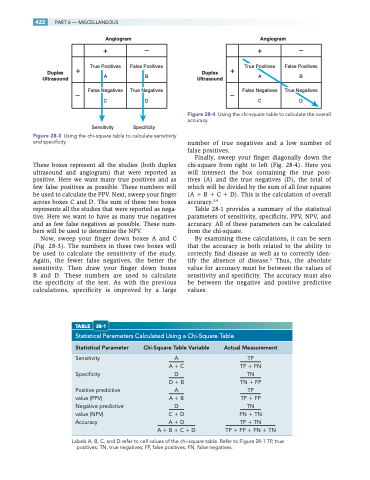
Angiogram Angiogram
+– +–
Duplex Ultrasound
+
True Positives A
False Positives B
Duplex + Ultrasound
True Positives A
False Positives B
True Negatives CD CD
True Negatives ––
False Negatives
False Negatives
Sensitivity Specificity
Figure 28-4 Using the chi-square table to calculate the overall accuracy.
number of true negatives and a low number of false positives.
Finally, sweep your finger diagonally down the chi-square from right to left (Fig. 28-4). Here you will intersect the box containing the true posi- tives (A) and the true negatives (D), the total of which will be divided by the sum of all four squares (A B C D). This is the calculation of overall accuracy.3,4
Table 28-1 provides a summary of the statistical parameters of sensitivity, specificity, PPV, NPV, and accuracy. All of these parameters can be calculated from the chi-square.
By examining these calculations, it can be seen that the accuracy is both related to the ability to correctly find disease as well as to correctly iden- tify the absence of disease.5 Thus, the absolute value for accuracy must be between the values of sensitivity and specificity. The accuracy must also be between the negative and positive predictive values.
Figure 28-3 Using the chi-square table to calculate sensitivity and specificity.
These boxes represent all the studies (both duplex ultrasound and angiogram) that were reported as positive. Here we want many true positives and as few false positives as possible. These numbers will be used to calculate the PPV. Next, sweep your finger across boxes C and D. The sum of these two boxes represents all the studies that were reported as nega- tive. Here we want to have as many true negatives and as few false negatives as possible. These num- bers will be used to determine the NPV.
Now, sweep your finger down boxes A and C (Fig. 28-3). The numbers in these two boxes will be used to calculate the sensitivity of the study. Again, the fewer false negatives, the better the sensitivity. Then draw your finger down boxes B and D. These numbers are used to calculate the specificity of the test. As with the previous calculations, specificity is improved by a large
TABLE 28-1
Statistical Parameters Calculated Using a Chi-Square Table
Statistical Parameter Chi-Square Table Variable Actual Measurement
Sensitivity A TP
AC Specificity D
A B C
TP FN
TN
TN FP
TP
TP FP
TN
FN TN TPTN
TP FP FN TN
Positive predictive
value (PPV)
Negative predictive
value (NPV)
Accuracy AD
DB A
A B D
C D
D
Labels A, B, C, and D refer to cell values of the chi-square table. Refer to Figure 28-1 TP, true positives; TN, true negatives; FP, false positives; FN, false negatives.
