
Page 226 - Libro vascular I
P. 226
Chap-14.qxd 29~8~04 14:55 Page 217
A
BC
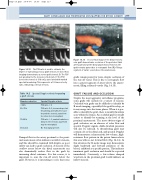
just proximal to the stenosis is 16.4 cm/s. C: The PSV across the stenosis is 319 cm/s, associated with marked spectral broadening. This represents a 19 times velocity ratio, indicating a critical stenosis.
R
Figure 14.13 A color flow image of the distal end of a vein graft demonstrates occlusion of the posterior tibial artery (arrows) at the distal anastomosis. However, the graft remains patent due to retrograde flow (R), filling a segment of native vessel above the anastomosis.
GRAFT SURVEILLANCE AND PREOPERATIVE VEIN MAPPING FOR BYPASS SURGERY
217
The PSV ratio is used to estimate the degree of narrowing across a graft stenosis. A: Color flow imaging demonstrates a severe graft stenosis. B: The PSV
Figure 14.12
grafts remain patent for years, despite occlusion of the run-off vessel. This is due to retrograde flow into a patent segment of artery above the anasto- mosis, filling collateral vessels (Fig. 14.13).
GRAFT FAILURE AND OCCLUSION
Despite the most aggressive surveillance programs, some grafts will occlude for a variety of reasons. Occluded vein grafts can be difficult to identify by B-mode imaging, especially if the graft lies deep, as it may merge into the tissue planes. When it is pos- sible to identify the graft, there is usually thrombus seen within the lumen. An occluded graft is usually easiest to identify by scanning at the level of the proximal anastomosis. The most obvious signs of graft occlusion are an absence of color flow and spectral Doppler signals. Ankle–brachial pressures will also be reduced. A thrombosing graft may contain clot at the distal end, and spectral Doppler will demonstrate a characteristic low-volume, high- resistance flow pattern in the patent lumen above this area with no net forward flow (Fig. 14.14). In this situation the B-mode image may demonstrate slight backward and forward pulsation of the blood, exhibited as a speckle pattern. This indicates imminent graft occlusion and should be reported immediately. Conversely, a low-volume damped waveform in the proximal graft would indicate an inflow stenosis.
Table 14.2 Spectral Doppler criteria for grading a graft stenosis
Diameter reduction
50% 50–70%
70–99%
Occlusion
Spectral Doppler criteria
PSV ratio 2
PSV ratio 2–3; increased spectral broadening and turbulence just beyond the stenosis; waveform becomes more monophasic
PSV ratio 3; marked turbulence distal to the stenosis; waveform may be monophasic
No flow signal present
Damped flow in the artery proximal to the proxi- mal anastomosis often indicates an inflow stenosis, and this should be examined with duplex, as poor inflow can lead to graft occlusion. A stenosis of the outflow artery below the distal anastomosis can also dramatically reduce flow in the graft by increasing distal resistance. For this reason, it is important to scan the run-off artery below the graft. However, it is interesting to note that some
