
Page 36 - Libro vascular I
P. 36
Chap-03.qxd 29~8~04 13:20 Page 27
DOPPLER ULTRASOUND
27
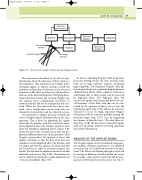
Direction discrimination
Oscillator
Demodulator
Filter and amplifier
Loudspeaker
Transmitting element
Sensitive region
Receiving element
Amplifier
Spectrum analyzer
Figure 3.5 Elements of a simple continuous wave Doppler system.
The instruments described so far will not give information about the direction of flow relative to the transducer. This information is available in the returning signal, as objects moving toward the transducer will produce an increase in the detected frequency, while those moving away will produce a decrease in the detected frequency. Extracting direc- tional information from the received Doppler sig- nal requires more sophisticated electronics or software and this will not be explained in this text- book. When the flow directions have been sepa- rated, stereo loudspeakers can be used with one channel for forward flow and the other for reverse.
It is preferable to display both the forward and reverse Doppler signals simultaneously on the same spectrum. This is done by displaying the signals either side of a baseline, with flow toward the trans- ducer displayed above the baseline and flow away from the transducer displayed below. Figure 3.6A shows the flow in the vertebral artery and vein dis- played in different directions on the spectrum. Most Doppler systems allow the operator to invert this display, if desired, so that the flow away from the transducer can be displayed above the baseline, and it is important that the operator be aware that this has been done in order to correctly interpret any results. The fact that the display is inverted is usually indicated on the screen (Fig. 3.6B). The baseline can also be shifted up and down to make maximum use of the spectral display (Fig. 3.6C).
As well as obtaining Doppler shift frequencies from the flowing blood, the slow moving vessel walls act as large reflective surfaces, producing large-amplitude, low-frequency Doppler shift sig- nals along with the low-amplitude high frequencies obtained from blood. These signals are known as wall thump, due to their sound, and are removed by high-pass filters. The high-pass filter will remove any signals with a frequency below the cut- off frequency of the filter, and this can be con- trolled by the operator. If this is set too low, the wall thump signal (Fig. 3.7A) will not be removed, whereas if it is set too high, important Doppler information will be removed, possibly altering the waveform shape (Fig. 3.7C) (e.g., by suggesting the absence of diastolic flow). The ideal filter set- ting (Fig. 3.7B) should remove unwanted signals such as wall thump without removing important blood flow information.
ANALYSIS OF THE DOPPLER SIGNAL
The Doppler signal can be investigated using spec- tral analysis, allowing waveforms to be displayed (as seen in Fig. 3.6) and blood velocity to be mea- sured. The blood cells flowing through a vessel will be moving at different velocities within the vessel; for example, cells near the vessel wall will be mov- ing more slowly than those in the center (see Ch. 5).
