
Page 37 - Libro vascular I
P. 37
Chap-03.qxd 29~8~04 13:20 Page 28
28
PERIPHERAL VASCULAR ULTRASOUND
A
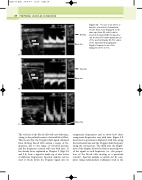
VEIN ARTERY
Normal
Base line
Inverted
Base line
Figure 3.6 The use of an offset, or baseline, allows both forward and reverse flows to be displayed on the same spectrum (A), which can be inverted if required (B). The baseline can be altered to make maximum use of the spectral display (C). The values of the transmitted imaging and Doppler frequencies are often displayed on the screen.
VEIN ARTERY
B
Base line
C
The velocity of the blood cells will vary with time, owing to the pulsatile nature of arterial blood flow. This means that the Doppler shift signal obtained from flowing blood will contain a range of fre- quencies, due to the range of velocities present, and the frequency content will vary with time. It has already been explained in Chapter 2 (Figs 2.3 and 2.4) how a signal is made up of sine waves of different frequencies. Spectral analysis can be used to break down the Doppler signal into its
component frequencies and to show how these component frequencies vary with time. Figure 3.8 shows how a spectrum is displayed, with time along the horizontal axis and the Doppler shift frequency along the vertical axis. The third axis, the bright- ness of the display, shows the back-scattered power of the signal at each frequency (i.e., the propor- tion of the blood cells moving at a particular velocity). Spectral analysis is carried out by com- puter using mathematical techniques such as the
