
Page 40 - Libro vascular I
P. 40
Chap-03.qxd 29~8~04 13:20 Page 31
DOPPLER ULTRASOUND
31
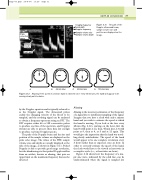
Imaging frequency band width Doppler frequency
Sample volume size Sample volume depth
Figure 3.11 The path of the Doppler ultrasound beam, sample volume size and position are displayed on the image.
Angle correction cursor
Sample volume
Beam path
12
A B
Aliasing. If the speed of a minute hand is observed once every 45 minutes, the hand will appear to be
93 6
45 min later C 90 min later D 135 min later
Figure 3.12
moving slowly anticlockwise.
Aliasing
Aliasing is the incorrect estimation of the frequency of a signal due to insufficient sampling of the signal. Imagine that you have a clock with only a minute hand and you wish to estimate the speed at which the hand is moving. If you look at the face every 45min (Fig. 3.12), starting on the hour, first the hand would point at 12, then, 45 min later, it would point at 9, then at 6, at 3 and at 12 again. This would give the impression that the hand was travel- ling slowly anticlockwise. The speed of the hand would appear to be one complete revolution every 3 hours rather than as expected, once an hour. In order to correctly estimate the speed of the hand, the clock would have to be viewed at least twice in a complete cycle (i.e., at least twice an hour).
Figure 3.13 shows how the frequency of a sim- ple sine wave, indicated by the solid line, can be underestimated when the signal is sampled less
by the Doppler equation and is typically referred to as the Doppler signal. The ultrasound pulses enable the changing velocity of the blood to be sampled, and the resulting signal can be analyzed to obtain a frequency spectrum using an FFT. The FFT requires either 64 or 128 consecutive pulses to produce one line of the spectrum, and Doppler systems are able to process these data fast enough to produce real-time Doppler spectra.
The path of the Doppler beam and the size and position of the sample volume are displayed on the pulse echo image. The values of the PRF, sample volume size and depth are usually displayed at the side of the image, as shown in Figure 3.11. Pulsed Doppler is able to provide good range resolution, but the disadvantage is that pulsed Doppler suffers from an artifact, known as aliasing, that puts an upper limit on the maximum frequency that can be detected.
