
Page 41 - Libro vascular I
P. 41
Chap-03.qxd 29~8~04 13:20 Page 32
32
PERIPHERAL VASCULAR ULTRASOUND
than twice in a complete cycle. If the dots (•) rep- resent the points at which the signal is sampled, then the lowest frequency sine wave that would fit the sampled data is that shown by the dashed line. If, instead, the signal is sampled at least twice in a complete cycle, shown by the crosses (), it is no longer possible to fit a lower frequency sine wave to the sampled data and the correct frequency is measured. Aliasing occurs when the sampling fre- quency is less than twice the frequency to be esti- mated, a limit known as the Nyquist frequency.
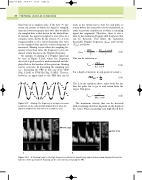
An example of aliasing of a Doppler signal can be seen in Figure 3.14A, where the frequency detected at peak systole is underestimated and dis- played below the baseline of the spectrum. Aliasing can be overcome by increasing the sampling rate (i.e., increasing the PRF in this case from 2500 [Fig. 3.14A] to 3704 Hz [Fig. 3.14B]). There is, however, an upper limit to the PRF that can be
Figure 3.13 Aliasing. The frequency of a simple sine wave (solid line) can be underestimated (dashed line) when the signal is sampled less than twice in a complete cycle.
PRF 2500
AB
PRF 3704
used, as the system has to wait for each pulse to return before the next pulse can be transmitted, in order to prevent confusion as to where a returning signal has originated. Therefore, there is also a limit to the maximum Doppler shift frequency that can be detected. This limits the maximum detectable Doppler frequency (fdmax) and velocity (Vmax) as follows:
(3.2)
fdmaxPRFmax 2Vmaxftcosu 2c
This can be rewritten as
Vmax PRFmaxc (3.3)
4ft cosu
For a depth of interest, d, and speed of sound, c,
PRFmax c (3.4) 2d
The 2, in the equation above, arises from the fact that the pulse has to go to and return from the target. This gives
c2
Vmax 8dft cos u (3.5)
The maximum velocity that can be detected without aliasing therefore depends on the depth of the vessel. When measuring very high blood flow
Figure 3.14 A: Aliasing leads to the high frequencies within the signal being underestimated and displayed below the baseline of the spectrum. B: Aliasing can be overcome by increasing the PRF.
