
Page 60 - Libro vascular I
P. 60
Chap-05.qxd 29~8~04 13:25 Page 51
BLOOD FLOW AND ITS APPEARANCE ON COLOR FLOW IMAGING
Mean arterial
pressure 45
Hydrostatic pressure
50
KE 12 rV 2
Line showing total energy
Entrance loss
Viscous loss through stenosis
Exit loss
Recovered pressure
Mean venous pressure
6 1000
KE
195 100
100 Mean arterial pressure 130 Typical peak systolic
Pressure energy Distance
permission.)
100
mmHg
A
B
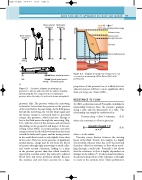
pressure) falls. The pressure within the narrowing is therefore lower than the pressure in the portion of the vessel before the narrowing. As the fluid passes beyond the narrowing, the velocity drops again and the kinetic energy is converted back to potential energy (the pressure), which increases. Energy is lost as the fluid passes through the narrowing (Fig. 5.2), with the extent of the entrance and exit losses depending on the geometry and degree of the nar- rowing (Oates 2001). In normal arteries, very little energy is lost as the blood flows away from the heart toward the limbs and organs, and the mean pressure in the small distal vessels is only slightly lower than in the aorta. However, in the presence of significant arterial disease, energy may be lost from the blood as it passes through tight narrowings or small collat- eral vessels around occlusions, leading to a drop in the pressure greater than that which would be expected in a normal artery; this can lead to reduced blood flow and tissue perfusion distally. Because the entrance and exit losses account for a large
Diagram showing how energy losses can occur across a narrowing. (After Oates 2001, with
along narrowing
51
Flow
95 140
Figure 5.2
mmHg
arterial pressure
proportion of the pressure loss, it is likely that two adjacent stenoses will have a more significant effect than one long one (Oates 2001).
RESISTANCE TO FLOW
In 1840, a physician named Poiseuille established a relationship between flow, the pressure gradient along a tube and the dimensions of a tube. The relationship can simply be understood as:
Pressure drop flow resistance where the resistance to flow is given by:
R viscositylength8 p p r r 4 4
(5.3)
(5.4)
where r is the radius.
Viscosity causes friction between the moving
layers of the fluid. Treacle, for example, is a highly viscous fluid, whereas water has a low viscosity and therefore offers less resistance to flow when travel- ling through a small tube. Poiseuille’s law shows that the resistance to flow is highly dependent on changes in the radius (r4). In the normal circulation, the greatest proportion of the resistance is thought to occur at the arteriole level. Tissue perfusion is
Schematic diagram showing typical pressures in arteries and veins with the subject standing (A) and lying (B). The component due to hydrostatic pressure when the subject is vertical is shown alongside A.
Figure 5.1
Energy
