
Page 61 - Libro vascular I
P. 61
Chap-05.qxd 29~8~04 13:25 Page 52
52
PERIPHERAL VASCULAR ULTRASOUND
controlled by changes in the diameter of the arte- rioles. The presence of arterial disease in the arteries, such as stenoses or occlusions, can significantly alter the resistance to flow, with the reduction in vessel diameter having a major effect on the change in resistance seen. In severe disease, the arterioles dis- tal to the disease may become maximally dilated in order to reduce the peripheral resistance, thus increasing blood flow in an attempt to maintain tis- sue perfusion. Poiseuille described nonpulsatile flow in a rigid tube, so his equation does not completely represent arterial blood flow; however, it gives us some understanding of the relationship between pressure drop, resistance and flow.
VELOCITY CHANGES WITHIN STENOSES
We have already seen that fluid travels faster through a narrowed section of tube. The theory to deter- mine these changes in velocity is described below. The volume flow through the tube is given by:
Flow velocity of the fluid cross-sectional area
QVA (5.5)
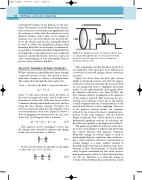
where V is the mean velocity across the whole of the vessel, averaged over time, and A is the cross- sectional area of the tube. If the tube has no outlets or branches through which fluid can be lost, the flow along the tube remains constant. Therefore, the velocity at any point along the tube depends on the cross-sectional area of the tube. Figure 5.3 shows a tube of changing cross-sectional area (A1, A2); now, as the flow (Q) along the tube is constant:
QV1 A1 V2 A2 (5.6)
This equation can be rearranged to show that the change in the velocities is related to the change in the cross-sectional area, as follows:
V2 A1 (5.7) V1 A2
As the cross-sectional area depends on the radius r of the tube (A r2), we have:
V A r2
2 1 1 (5.8)
V1 A2 r 2 2
Q
V1V2A2
r2
r1
Change in cross-sectional area. As the flow is constant through the tube, the velocity of the fluid increases from V1 to V2 as the cross-sectional area decreases from A1 to A2.
A1
Figure 5.3
This relationship actually describes steady flow in a rigid tube, but it does give us an indication as to how the velocity will change across a stenosis in an artery.
Figure 5.4 shows how the flow and velocity within an idealized stenosis vary with the degree of diameter reduction caused by the stenosis, based on the predictions from a simplified theoretical model. On the right-hand side of the graph, where the diameter reduction is less than 70–80%, the flow remains relatively unchanged as the diameter of the vessel is reduced. This is because the pro- portion of the resistance to flow due to the stenosis is small compared with the overall resistance of the vascular bed that the vessel is supplying. However, as the diameter reduces farther, the resistance offered by the stenosis becomes a significant pro- portion of the total resistance, and the stenosis begins to limit the flow. This is known as a hemo- dynamically significant stenosis. At this point, the flow decreases quickly as the diameter is reduced.
The graph also predicts the behavior of the veloc- ity as the vessel diameter is reduced and shows that the velocity increases with diameter reduction. Noticeable changes in velocity begin to occur at much smaller diameter reductions than would pro- duce a flow reduction. Therefore, measurement of velocity changes is a more sensitive method of detecting small-vessel lumen reductions than meas- urement of flow. Measurements of velocity made using Doppler ultrasound are also more accurate than measurement of flow, as will be discussed later (see Ch. 6). Therefore, it is often the change in velocity of blood within a diseased artery that is used
