
Page 63 - Libro vascular I
P. 63
Chap-05.qxd 29~8~04 13:25 Page 54
54
PERIPHERAL VASCULAR ULTRASOUND
ab
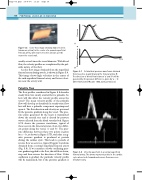
SFA
Figure 5.6 Color flow image showing high velocities (shown as yellow) in the center of a normal superficial femoral artery, with lower velocities (shown as red) nearer the vessel wall.
usually several times the vessel diameter. With blood flow, the velocity profiles are complicated by the pul- satile nature of the flow.
A color flow image obtained from the superficial femoral artery, during systole, is shown in Figure 5.6. This image shows high velocities in the center of the mid-superficial femoral artery and lower veloci- ties near the artery wall.
Pulsatile flow
The flow profiles considered in Figure 5.5 describe steady flow, but clearly arterial flow is pulsatile. So how will this affect the velocity profile across the vessel? The mean velocity profile of the pulsatile flow will develop as described for steady-state flow but will have a pulsatile component superimposed upon it. The flow direction and velocity are governed by the pressure gradient along the vessel. The pres- sure pulse generated by the heart is transmitted down the arterial tree and is altered by pressure waves reflected from the distal vascular bed. Figure 5.7A shows the pressure waveforms, typical of those seen in the femoral arteries, from two differ- ent points along the vessel, ‘a’ and ‘b’. The pres- sure difference between these two points is given by a b, as shown in Figure 5.7B, such that a neg- ative pressure gradient is produced at periods during the cardiac cycle. This leads to periods of reverse flow as seen in a typical Doppler waveform obtained from a normal superficial femoral artery (Fig. 5.8). If we consider a slowly oscillating pres- sure gradient applied to the flow, this will slow down, stop and then reverse the direction of flow. If this oscillation is gradual, the parabolic velocity profile will be maintained, but if the pressure gradient is
Time
Time
A
B
The direction of blood flow between ‘a’ and ‘b’ will be governed by the pressure difference, given by ‘a b’. (After Nichols & O’Rourke 1990, with permission.)
A: Idealized pressure waveforms obtained from two sites (a and b) along the femoral artery. B:
Figure 5.7
Velocity waveform in a normal superficial femoral artery. The arrows represent points in the cardiac cycle where both forward and reverse flows are seen simultaneously.
Figure 5.8
Pressure difference a b Pressure
