
Page 64 - Libro vascular I
P. 64
Chap-05.qxd 29~8~04 13:25 Page 55
BLOOD FLOW AND ITS APPEARANCE ON COLOR FLOW IMAGING
55
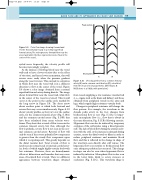
Peak systole
SFA
Figure 5.9 Color flow image showing forward and reverse flow simultaneously in a normal superficial femoral artery. The red represents forward flow near the vessel wall while the blue represents reverse flow in the center of the vessel.
cycled more frequently, the velocity profile will become increasingly complex.
As the laminae of flowing blood near the vessel wall tend to have a lower velocity (due to the effect of viscosity), and hence lower momentum, they will reverse more easily when the pressure gradient along the vessel reverses. This can lead to a situation in which flow near the vessel wall is in a different direction to flow at the center of the vessel. Figure 5.9 shows a color image obtained from a normal superficial femoral artery during diastole. The image shows forward flow near the vessel wall, while flow in the center of the vessel is reversed. This would occur at the point in the cardiac cycle marked by the long arrow in Figure 5.8. The short arrow shows another point at which both forward and reverse flow may occur simultaneously. Figure 5.10 shows velocity profiles, as they vary over the cardiac cycle, for the common femoral artery (Fig. 5.10A) and the common carotid artery (Fig. 5.10B) that have been calculated from mean velocity wave- forms. They show that reversal of flow is seen in the common femoral artery, but that, although the flow is pulsatile, reverse flow is not seen in the nor- mal common carotid artery. Reversal of flow will only be seen if the reverse pulsatile flow component is greater than the steady flow component upon which it is superimposed. This greatly depends on the distal vascular bed. Total reversal of flow is rarely seen in normal renal or internal carotid arter- ies, both of which supply highly vascular beds with low resistance. However, there are hemodynamic effects at bifurcations and branches that may cause areas of localized flow reversal. There is a different appearance between waveform shapes obtained
End systole
Figure 5.10 Velocity profiles from a common femoral artery (A) and a common carotid artery (B), calculated from the mean velocity waveforms. (After Evans & McDickens et al 1999, with permission.)
AB
from vessels supplying a low-resistance vascular bed (i.e., organs such as the brain and kidney) and those obtained from peripheral vessels in the arms and legs, which supply high-resistance vascular beds.
Changes in peripheral resistance will change the flow pattern. For example, the waveform in the dorsalis pedis artery in the foot changes from bi-directional flow at rest (Fig. 5.11A) to hyper- emic monophasic flow (i.e., flow that is always in the same direction; Fig. 5.11B) following exercise. Hyperemic flow can also be induced by temporary occlusion of the calf arteries using a blood pressure cuff. The lack of blood flow during the arterial occlu- sion with the cuff, or the increase in demand during exercise, causes the distal vessels to dilate in order to reduce peripheral resistance and maximize blood flow, and this is reflected in the change in shape of the waveform seen directly after cuff release. The hyperemic flow soon returns to bi-directional flow once adequate perfusion has occurred. This change in shape can also be seen when hyperemic flow is induced by infection. Monophasic flow is also seen in the lower limb, distal to severe stenoses or occlusions (Fig. 5.11C). This waveform shape is
