
Page 78 - Libro vascular I
P. 78
Chap-06.qxd 29~8~04 14:41 Page 69
FACTORS THAT INFLUENCE THE DOPPLER SPECTRUM
69
unless the ISB produced by a given scanner is taken into account when developing velocity criteria for the quantification of disease. Early duplex scanners, before the development of linear array transducers, used single-element Doppler probes that produce low ISB. The velocity measurements made using these older ultrasound scanners were not prone to ISB errors, and therefore the velocity criteria pro- duced using them may differ from those produced using linear array transducers. The error produced due to spectral broadening can vary with changes in the active aperture that accompany changes in the sample volume depth. The error also varies among manufacturers. It is therefore recommended that departments compare their ultrasound results with those obtained from angiography or other imaging techniques.
Diagnosis of vascular disease often depends on velocity ratio measurements, and these are not affected by the errors produced by ISB as long as both measurements used to calculate the ratio are made with a similar angle of insonation. If the veloc- ity ratios are calculated using two velocity measure- ments made with significantly different angles of insonation, significant errors may be introduced.
Optimizing the angle of insonation
Ideally, the angle of insonation for estimating velocity measurement should be zero to minimize errors; however, as peripheral vessels often lie par- allel to the skin, this is not possible. No single choice of angle of insonation is completely reliable, especially when comparisons between velocity mea- surements are being made. The possibilities are discussed below:
Velocity ratio measurements
Ideally the angle of insonation used to make the velocity measurement proximal to and at the steno- sis should be similar. This will result in the two velocities having similar errors that will cancel out when calculating the ratio.
Absolute velocity measurements
There are two schools of thought about selecting the angle of insonation when making absolute
A
True velocity
B
0
30 50 70
Angle of insonation
60
30
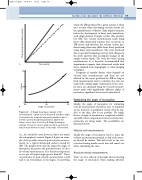
Figure 6.8 A: Graph showing an example of the
overestimation of peak velocity measured at a given angle of insonation by a typical linear array transducer due to intrinsic spectral broadening (solid line). Dashed line shows correct value of velocity. B: Graph showing an example of how the error in peak velocity measurements may increase with an increase in the angle of insonation.
(i.e., 1) should be used; however, this is not under the sonographer’s control. Figure 6.8 gives an exam- ple of the possible errors in peak velocity measure- ments on a typical ultrasound scanner caused by ISB. The graphs show that the larger the angle of insonation, the greater the potential source of error in velocity measurement. It is therefore important not to use a Doppler angle greater than 60°. These overestimates in peak velocity measurements could lead to an overestimate in the degree of narrowing
% Error
Peak velocity measured by scanner
