
Page 76 - Libro vascular I
P. 76
Chap-06.qxd 29~8~04 14:41 Page 67
FACTORS THAT INFLUENCE THE DOPPLER SPECTRUM
67
beam and the blood flow. The angle of insonation is measured by lining up the angle correction cur- sor with the estimated direction of flow.
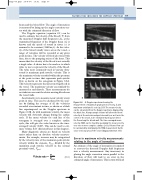
The Doppler equation (equation 3.1) can be used to estimate the velocity of the blood (V ) from the measured Doppler shift frequency (fd), as the transmitted frequency of the Doppler beam (ft) is known and the speed of sound in tissue (c) is assumed to be constant (1540 m/s). As the veloc- ity of the blood usually varies across the vessel, a range of velocities will be recorded at any given point in time. The velocity of blood also varies with time, due to the pumping action of the heart. This means that the velocity of the blood is not actually a single value. A choice has to be made as to which value to use to represent the velocity of the blood. The value most commonly used in vascular ultra- sound is maximum peak systolic velocity. This is the maximum velocity recorded within the spectrum at the point in time that represents peak systolic flow, as shown on the sonogram in Figure 6.6A. This velocity represents the fastest moving blood in the vessel. The maximum velocity can similarly be measured at end diastole. These measurements do not take into account the slower moving blood near the vessel walls.
An alternative is to measure mean velocity at any point in time. This can be calculated by the scan- ner by finding the average of all the velocities recorded at an instant in time, as shown as a black line superimposed on the Doppler spectrum in Figure 6.6B. As with maximum velocity, the mean velocity will obviously change during the cardiac cycle. If the mean velocity for each line of the sonogram is averaged over a complete cardiac cycle, this will give the value known as the time- averaged velocity (TAV). This can be used to esti- mate volume flow (discussed later in this chapter).
Many diagnostic criteria are based on velocity ratios rather than on absolute velocity measure- ments. For example, stenoses may be categorized by the velocity ratio of the maximum peak systolic velocity within the stenosis, Vsten, divided by the maximum peak systolic velocity in the normal proximal vessel, Vprox:
(6.1)
measurement of maximum peak systolic velocity, S, and maximum end diastolic velocity, D. B: The mean velocity can be calculated from the Doppler spectrum, displayed by the black line. A large sample volume will allow the blood velocity at the anterior and posterior walls, as well as in the center of the vessel, to be estimated but may not detect the flow along the lateral wall. The time-averaged mean velocity, TAM, can be found by averaging the mean velocity over one or more complete cardiac cycles. Volume flow can be calculated by multiplying the TAM measurement by the cross-sectional area of the vessel (displayed bottom left).
S
D
A
B
Figure 6.6 A: Doppler spectrum showing the
Errors in maximum velocity measurements
relating to the angle of insonation
An estimate of the angle of insonation is required to convert the detected Doppler shift frequency into a velocity measurement. Any inaccuracy in placing the angle correction cursor parallel to the direction of flow will lead to an error in the estimated angle of insonation. This in turn will lead
Velocity ratio Vsten prox
