
Page 11 - Economic transformation
P. 11
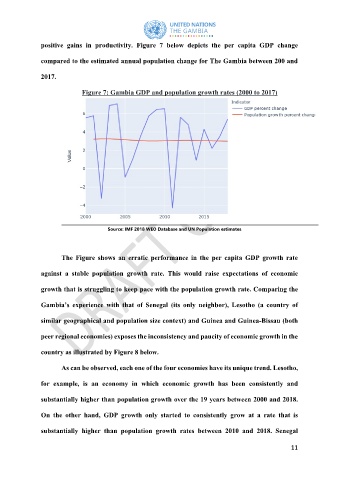
positive gains in productivity.  Figure 7 below depicts the per capita GDP change

               compared to the estimated annual population change for The Gambia between 200 and


               2017.

                              Figure 7: Gambia GDP and population growth rates (2000 to 2017)


                                       Source: IMF 2018 WEO Database and UN Population estimates


                       The Figure shows an erratic  performance in the per capita GDP growth rate


               against a stable  population growth  rate. This would raise expectations of economic

               growth that is struggling to keep pace with the population growth rate. Comparing the


               Gambia’s experience  with that of  Senegal  (its only neighbor), Lesotho (a country of

               similar geographical and population size context) and Guinea and Guinea-Bissau (both


               peer regional economies) exposes the inconsistency and paucity of economic growth in the

               country as illustrated by Figure 8 below.


                       As can be observed, each one of the four economies have its unique trend. Lesotho,

               for example, is an economy in which economic growth has been consistently and

               substantially higher than population growth over the 19 years between 2000 and 2018.


               On the other hand, GDP growth only started to consistently grow at a  rate that is

               substantially higher than population growth rates between 2010 and 2018. Senegal


                                                                                                       11