
Page 8 - Economic transformation
P. 8
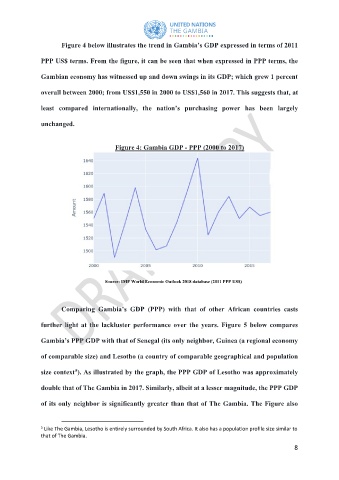
Figure 4 below illustrates the trend in Gambia’s GDP expressed in terms of 2011

               PPP US$ terms. From the figure, it can be seen that when expressed in PPP terms, the


               Gambian economy has witnessed up and down swings in its GDP; which grew 1 percent

               overall between 2000; from US$1,550 in 2000 to US$1,560 in 2017. This suggests that, at


               least compared internationally, the nation’s purchasing  power has been largely

               unchanged.


                                         Figure 4: Gambia GDP - PPP (2000 to 2017)


                                      Source: IMF World Economic Outlook 2018 database (2011 PPP US$)


                       Comparing Gambia’s GDP (PPP) with  that  of other African countries  casts

               further light at  the lackluster performance over  the years. Figure  5 below compares


               Gambia’s PPP GDP with that of Senegal (its only neighbor, Guinea (a regional economy

               of comparable size) and Lesotho (a country of comparable geographical and population

                           5
               size context ). As illustrated by the graph, the PPP GDP of Lesotho was approximately

               double that of The Gambia in 2017. Similarly, albeit at a lesser magnitude, the PPP GDP

               of its only neighbor is significantly greater than that of The Gambia. The Figure also


               5  Like The Gambia, Lesotho is entirely surrounded by South Africa. It also has a population profile size similar to
               that of The Gambia.
                                                                                                        8