
Page 2 - Las Vegas LVQR Market Research Report Q1 2024
P. 2
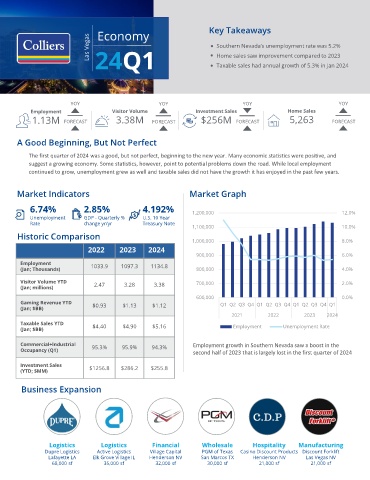
Economy
                              Las Vegas  24Q1                         Key Takeaways
                                                                         Southern Nevada’s unemployment rate was 5.2%
                                                                         Home sales saw improvement compared to 2023
                                                                         Taxable sales had annual growth of 5.3% in Jan 2024


                        YOY                           YOY                        YOY                             YOY
           Employment                 Visitor Volume              Investment Sales              Home Sales
            1.13M  FORECAST            3.38M       FORECAST        $256M       FORECAST          5,263         FORECAST


       A Good Beginning, But Not Perfect


           The first quarter of 2024 was a good, but not perfect, beginning to the new year. Many economic statistics were positive, and
           suggest a growing economy. Some statistics, however, point to potential problems down the road. While local employment
           continued to grow, unemployment grew as well and taxable sales did not have the growth it has enjoyed in the past few years.


       Market Indicators                                        Market Graph

           6.74%             2.85%              4.192%           1,200,000                                        12.0%
           Unemployment      GDP - Quarterly %   U.S. 10 Year
           Rate              change yr/yr       Treasury Note
                                                                 1,100,000                                        10.0%
       Historic Comparison
                                                                 1,000,000                                        8.0%
                              2022       2023     2024
                                                                  900,000                                         6.0%
        Employment
        (Jan; Thousands)       1033.9    1097.3    1134.8         800,000                                         4.0%
        Visitor Volume YTD      2.47      3.28      3.38          700,000                                         2.0%
        (Jan; millions)
                                                                  600,000                                         0.0%
        Gaming Revenue YTD      $0.93     $1.13    $1.12                  Q1 Q2 Q3 Q4 Q1 Q2 Q3 Q4 Q1 Q2 Q3 Q4 Q1
        (Jan; $BB)
                                                                              2021        2022        2023   2024
        Taxable Sales YTD       $4.40     $4.90    $5.16                      Employment       Unemployment Rate
        (Jan; $BB)

        Commercial+Industrial   95.3%    95.9%     94.3%         Employment growth in Southern Nevada saw a boost in the
        Occupancy (Q1)                                           second half of 2023 that is largely lost in the first quarter of 2024

        Investment Sales
        (YTD; $MM)             $1256.8   $286.2    $255.8

        Business Expansion


                 Logistics        Logistics        Financial        Wholesale        Hospitality    Manufacturing
                                 Active Logistics
                Dupre Logistics
        Colliers | Salt Lake County| 21Q1 | Office Report  Village Capital  PGM of Texas  Casino Discount Products Discount Forklift
                 Lafayette LA   Elk Grove Village IL  Henderson NV  San Marcos TX    Henderson NV     Las Vegas NV
                  68,000 sf        35,000 sf        32,000 sf         30,000 sf        21,000 sf        21,000 sf