
Page 4 - Las Vegas LVQR Market Research Report Q1 2024
P. 4
Colliers 4
Economy
Las Vegas 24Q1
Investment Sales On the other hand, inflation remained stubbornly high relative to
the post-Great Recession period, and for many potential home
Commercial real estate investment sales volume in the first
buyers home prices remained out of reach. The overall economy
quarter of 2024 was $255.8 million in 42 sales totaling 1.1 million
appeared to be healthy, but families and individuals do not seem
square feet. The average price per square foot for commercial
to be pleased with their personal situations.
property was $242.12, a 3.4% decrease from one year ago. The
overall cap rate for commercial space was 6.0%. Aside from this, there are two statistics that keep us from being
entirely satisfied with the current economic picture. The first is
Annual investment sales volume growth was 7.2% for industrial,
the rather remarkable month-over-month decrease of 1.5 million
-4.5% for single-tenant retail, -15% for retail centers, -17.1% for
full time jobs experienced in December 2023 in the United States.
medical office and -39.1% for professional office properties.
Full time jobs continued to decrease in January and February of
Forecast 2024. Part-time employment increased in December 2023, but not
enough to offset full-time job loss. This is curious and points to
The picture remains largely positive for Southern Nevada’s
shifting work patterns that could prove challenging to the
economy after the close of the first quarter. Employment commercial real estate sector.
continued to grow, taxable sales appear to be heading in the right
direction and the hospitality sector enjoyed a boost from the The other worrying factor is 125% annual growth in vacant
Valley hosting Super Bowl LVIII. The housing sector also appeared sublease space, most of it in the industrial sector. Sublease space
to be on the mend from a lackluster 2023. can be a canary in the coal mine, and could be warning of
softening demand for commercial real estate in the near future.
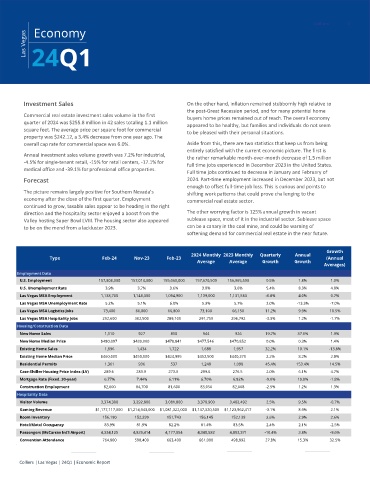
Growth
2024 Monthly 2023 Monthly Quarterly Annual
Type Feb-24 Nov-23 Feb-23 (Annual
Average Average Growth Growth
Averages)
Employment Data
U.S. Employment 157,808,000 157,014,000 155,060,000 157,670,500 156,065,500 0.5% 1.8% 1.0%
U.S. Unemployment Rate 3.9% 3.7% 3.6% 3.8% 3.6% 5.4% 8.3% 4.8%
Las Vegas MSA Employment 1,138,700 1,148,300 1,094,900 1,139,000 1,131,583 -0.8% 4.0% 0.7%
Las Vegas MSA Unemployment Rate 5.2% 5.1% 6.0% 5.3% 5.7% 2.0% -13.3% -7.0%
Las Vegas MSA Logistics Jobs 73,400 66,000 66,800 73,100 66,150 11.2% 9.9% 10.5%
Las Vegas MSA Hospitality Jobs 292,600 302,500 289,100 291,750 296,792 -3.3% 1.2% -1.7%
Housing/Construction Data
New Home Sales 1,110 927 810 944 926 19.7% 37.0% 1.9%
New Home Median Price $480,097 $480,000 $478,841 $477,546 $470,852 0.0% 0.3% 1.4%
Existing Home Sales 1,896 1,434 1,722 1,688 1,957 32.2% 10.1% -13.8%
Existing Home Median Price $460,000 $450,000 $424,995 $452,500 $440,370 2.2% 8.2% 2.8%
Residential Permits 1,361 936 537 1,248 1,090 45.4% 153.4% 14.5%
Case-Shiller Housing Price Index (LV) 289.6 283.9 273.0 289.6 276.5 2.0% 6.1% 4.7%
Mortgage Rate (Fixed, 30-year) 6.77% 7.44% 6.11% 6.70% 6.82% -9.0% 10.8% -1.8%
Construction Employment 82,600 84,700 81,600 83,050 82,008 -2.5% 1.2% 1.3%
Hospitality Data
Visitor Volume 3,374,300 3,292,800 3,081,800 3,378,900 3,402,492 2.5% 9.5% -0.7%
Gaming Revenue $1,177,117,000 $1,214,943,000 $1,081,322,000 $1,147,320,500 $1,123,962,417 -3.1% 8.9% 2.1%
Room Inventory 156,190 152,299 151,743 156,145 152,139 2.6% 2.9% 2.6%
Hotel/Motel Occupancy 83.9% 81.9% 82.2% 81.4% 83.5% 2.4% 2.1% -2.5%
Passengers (McCarran Int'l Airport) 4,334,125 4,839,414 4,177,054 4,340,582 4,803,371 -10.4% 3.8% -9.6%
Convention Attendance 764,800 598,400 663,400 661,000 498,892 27.8% 15.3% 32.5%
Colliers | Las Vegas | 24Q1 | Economic Report