
Page 8 - Las Vegas LVQR Market Research Report Q1 2024
P. 8
Colliers 4
Industrial
Las Vegas 24Q1
Project Subtype Status Submarket Size (SF) Pre-Leasing
25q1 4,733,411 8.4%
Clarion North 15 Logistics IV 1/2 Warehouse/Distribution PC North Las Vegas 734,310 0.0%
Craig Crossing Light Distribution AD North Las Vegas 77,380 0.0%
Dean Martin Business Center A/B/C/D Incubator PC Southwest 194,863 0.0%
Moonwater West Warehouse/Distribution PC Apex 922,569 0.0%
Nancy J Industrial Park C/D/E/F/G/H Light Distribution AD Henderson 286,996 0.0%
OMP Gateway 11 1/2 Warehouse/Distribution AD Henderson 1,748,820 0.0%
Oquendo Industrial Light Industrial PC Airport 33,100 0.0%
ProLogis Desert Inn Distribution Center Warehouse/Distribution AD West Central 153,220 0.0%
Rainbow @ Blue Diamond Logistics Park 4 Light Distribution UC Southwest 36,493 0.0%
Westport West Henderson Ph 1/2 Warehouse/Distribution PC West Henderson 148,220 0.0%
Windsor Commerce Park G Warehouse/Distribution UC North Las Vegas 397,440 100.0%
Vacancy & Rents
Industrial vacancy increased to 4.8% this quarter, due primarily to record levels of construction and lower-than-usual pre-leasing in completed
projects. East Las Vegas had the Valley’s lowest vacancy at 0.8%, while the highest vacancy rate was 20.9% in Apex.
The weighted average asking rate for industrial product in Southern Nevada decreased to $1.12 psf NNN from last quarter’s $1.28 psf NNN and
from $1.21 psf NNN one year ago. This represented -7.4% annual rent growth. On a product type basis, annual rent growth was +8.4% for
warehouse/distribution, -0.9% for light distribution, +5.9% for light industrial, +3.9% for incubator and +13.4% for flex properties. Warehouse/
distribution and light distribution properties have had the lion’s share of development over the past five years, and record development over
the last two quarters. This increase in inventory has no doubt impacted asking rental rates for those product types that experienced it.
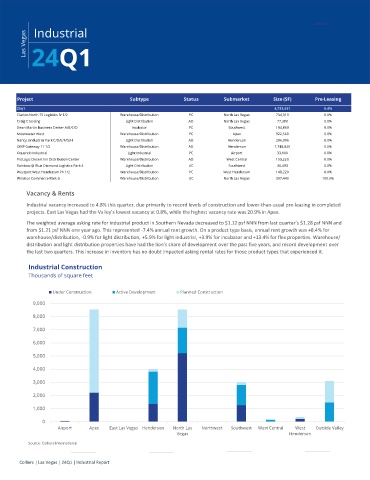
Industrial Construction
Thousands of square feet
Under Construction Active Development Planned Construction
9,000
8,000
7,000
6,000
5,000
4,000
3,000
2,000
1,000
0
Airport Apex East Las Vegas Henderson North Las Northwest Southwest West Central West Outside Valley
Vegas Henderson
Source: Colliers International
Colliers | Las Vegas | 24Q1 | Industrial Report