
Page 31 - Las Vegas LVQR Market Research Report Q1 2024
P. 31
Colliers 3
Hospitality
Las Vegas 24Q1
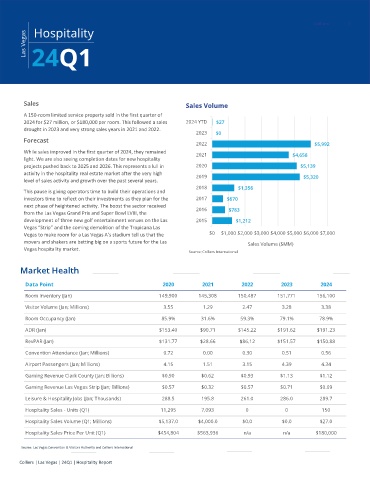
Sales Sales Volume
A 150-room limited service property sold in the first quarter of
2024 for $27 million, or $180,000 per room. This followed a sales 2024 YTD $27
drought in 2023 and very strong sales years in 2021 and 2022.
2023 $0
Forecast
2022 $5,992
While sales improved in the first quarter of 2024, they remained 2021 $4,658
light. We are also seeing completion dates for new hospitality
projects pushed back to 2025 and 2026. This represents a lull in 2020 $5,139
activity in the hospitality real estate market after the very high 2019 $5,320
level of sales activity and growth over the past several years.
2018 $1,356
This pause is giving operators time to build their operations and
investors time to reflect on their investments as they plan for the 2017 $670
next phase of heightened activity. The boost the sector received 2016 $783
from the Las Vegas Grand Prix and Super Bowl LVIII, the
development of three new golf entertainment venues on the Las 2015 $1,212
Vegas “Strip” and the coming demolition of the Tropicana Las
Vegas to make room for a Las Vegas A’s stadium tell us that the $0 $1,000 $2,000 $3,000 $4,000 $5,000 $6,000 $7,000
movers and shakers are betting big on a sports future for the Las Sales Volume ($MM)
Vegas hospitality market.
Source: Colliers International
Market Health
Data Point 2020 2021 2022 2023 2024
Room Inventory (Jan) 149,900 145,308 150,487 151,771 156,100
Visitor Volume (Jan; Millions) 3.55 1.29 2.47 3.28 3.38
Room Occupancy (Jan) 85.9% 31.6% 59.3% 79.1% 78.9%
ADR (Jan) $153.40 $90.71 $145.22 $191.62 $191.23
RevPAR (Jan) $131.77 $28.66 $86.12 $151.57 $150.88
Convention Attendance (Jan; Millions) 0.72 0.00 0.30 0.51 0.56
Airport Passengers (Jan; Millions) 4.15 1.51 3.15 4.39 4.34
Gaming Revenue Clark County (Jan; Billions) $0.90 $0.62 $0.93 $1.13 $1.12
Gaming Revenue Las Vegas Strip (Jan; Billions) $0.57 $0.32 $0.57 $0.71 $0.69
Leisure & Hospitality Jobs (Jan; Thousands) 288.5 195.8 261.0 286.0 289.7
Hospitality Sales - Units (Q1) 11,295 7,093 0 0 150
Hospitality Sales Volume (Q1; Millions) $5,137.0 $4,000.0 $0.0 $0.0 $27.0
Hospitality Sales Price Per Unit (Q1) $454,804 $563,936 n/a n/a $180,000
Source: Las Vegas Convention & Visitors Authority and Colliers International
Colliers | Las Vegas | 24Q1 | Hospitality Report