Page 29 - Las Vegas LVQR Market Research Report Q1 2024
P. 29

Hospitality
                               Las Vegas  24Q1                        Key Takeaways
                                                                         The sales drought of 2023 ended this quarter
                                                                         Visitor volume posted annual growth of 9.5% in Feb
                                                                         Gaming revenue posted annual growth of 8.9% in Feb


                        YOY                           YOY                        YOY                             YOY
          Occupancy Rate               Total Sales                 Sales Volume              Average Price/Unit
            83.0%  FORECAST          150 UNITS     FORECAST        $27MM      FORECAST        $180,000         FORECAST


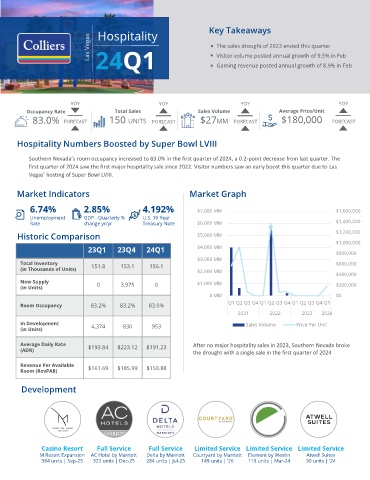
       Hospitality Numbers Boosted by Super Bowl LVIII


           Southern Nevada’s room occupancy increased to 83.0% in the first quarter of 2024, a 0.2-point decrease from last quarter. The
           first quarter of 2024 saw the first major hospitality sale since 2022. Visitor numbers saw an early boost this quarter due to Las
           Vegas’ hosting of Super Bowl LVIII.

       Market Indicators                                        Market Graph

           6.74%             2.85%              4.192%            $7,000 MM                                     $1,600,000
           Unemployment      GDP - Quarterly %   U.S. 10 Year
           Rate              change yr/yr       Treasury Note     $6,000 MM                                     $1,400,000

       Historic Comparison                                        $5,000 MM                                     $1,200,000
                                                                                                                $1,000,000
                              23Q1      23Q4     24Q1             $4,000 MM
                                                                                                                $800,000
                                                                  $3,000 MM
        Total Inventory                                                                                         $600,000
        (in Thousands of Units)   151.8  153.1    156.1           $2,000 MM
                                                                                                                $400,000
        New Supply               0       3,975      0             $1,000 MM                                     $200,000
        (in Units)
                                                                      $ MM                                      $0
        Room Occupancy         83.2%     83.2%    83.0%                     Q1 Q2 Q3 Q4 Q1 Q2 Q3 Q4 Q1 Q2 Q3 Q4 Q1
                                                                                2021      2022       2023  2024
        In Development         4,374      830      953                            Sales Volume     Price Per Unit
        (in Units)

        Average Daily Rate    $193.84   $223.12  $191.23         After no major hospitality sales in 2023, Southern Nevada broke
        (ADR)                                                    the drought with a single sale in the first quarter of 2024

        Revenue Per Available
        Room (RevPAR)         $161.69   $185.99  $150.88

        Development


               Casino Resort     Full Service     Full Service   Limited Service Limited Service Limited Service
        Colliers | Salt Lake County| 21Q1 | Office Report
              M Resort Expansion  AC Hotel by Marriott  Delta by Marriott  Courtyard by Marriott  Element by Westin  Atwell Suites
               384 units | Sep-25  322 units | Dec-25  284 units | Jul-25  149 units | ‘26  119 units | Mar-24  90 units | ‘24
   24   25   26   27   28   29   30   31   32   33   34