
Page 8 - 2018 Forecast_Neat
P. 8
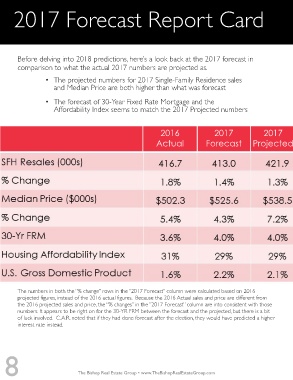
2017 Forecast Report Card


        Before delving into 2018 predictions, here’s a look back at the 2017 forecast in
        comparison to what the actual 2017 numbers are projected as.


                    •  The projected numbers for 2017 Single-Family Residence sales
                        and Median Price are both higher than what was forecast

                    •  The forecast of 30-Year Fixed Rate Mortgage and the
                        Affordability Index seems to match the 2017 Projected numbers


                                                                    2016                   2017                2017

                                                                  Actual               Forecast            Projected


        The numbers in both the “% change” rows in the “2017 Forecast” column were calculated based on 2016
        projected figures, instead of the 2016 actual figures.  Because the 2016 Actual sales and price are different from
        the 2016 projected sales and price, the “% changes” in the “2017 Forecast” column are into consistent with those
        numbers. It appears to be right on for the 30-YR FRM between the forecast and the projected, but there is a bit
        of luck involved.  C.A.R. noted that if they had done forecast after the election, they would have predicted a higher
        interest rate instead.


   8                              The Bishop Real Estate Group • www.TheBishopRealEstateGroup.com