
Page 449 - Microeconomics, Fourth Edition
P. 449
c10competitive markets applications.qxd 7/15/10 4:58 PM Page 423
10.5 IMPORT QUOTAS AND TARIFFS 423
$20
Price (dollars per unit) A Domestic supply
$8
B
$6 C E
F H J
G K
P = $4
w
L
$2
Domestic demand
Q = 2 Q = 4 Q = 6 Q = 8 10
1 2 3 5
Q = 7
4
Quantity (millions of units per year)
With Quota Impact of Quota
Free Trade
(with no quota) Trade Prohibition Quota = 3 Million Impact of Trade Impact of Quota = 3
(quota = 0) Units Per Year Prohibition Million Units Per Year
Consumer A + B + C + A A + B + C + E –B – C – E – F – –F – G – H – J – K
surplus E + F + G + H + G – H – J – K
(domestic) J + K
Producer L B + F + L F + L B + F F
surplus
(domestic)
Net benefits A + B + C + E + A + B + F + L A + B + C + E + –C – E – G – –G – H – J – K
(domestic) F + G + H + J + F + L H – J – K
(consumer K + L
surplus + domestic
producer surplus)
Deadweight zero C + E + G + H + G + H + J + K C + E + G + H + G + H + J + K
loss J + K J + K
Producer surplus zero zero H + J zero H + J
(foreign)
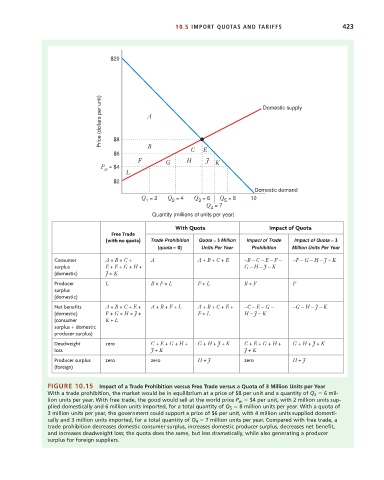
FIGURE 10.15 Impact of a Trade Prohibition versus Free Trade versus a Quota of 3 Million Units per Year
With a trade prohibition, the market would be in equilibrium at a price of $8 per unit and a quantity of Q 3 6 mil-
lion units per year. With free trade, the good would sell at the world price P w $4 per unit, with 2 million units sup-
plied domestically and 6 million units imported, for a total quantity of Q 5 8 million units per year. With a quota of
3 million units per year, the government could support a price of $6 per unit, with 4 million units supplied domesti-
cally and 3 million units imported, for a total quantity of Q 4 7 million units per year. Compared with free trade, a
trade prohibition decreases domestic consumer surplus, increases domestic producer surplus, decreases net benefit,
and increases deadweight loss; the quota does the same, but less dramatically, while also generating a producer
surplus for foreign suppliers.