
Page 718 - Microeconomics, Fourth Edition
P. 718
c16GeneralEquilibriumTheory.qxd 8/16/10 9:14 PM Page 692
692 CHAPTER 16 GENERAL EQUILIBRIUM THEORY
16.21. Consider an economy that uses labor and capital a) Which country has an absolute advantage in the pro-
to produce two goods, beer (x) and peanuts ( y), subject to duction of watches? In the production of automobiles?
technologies that exhibit constant returns to scale. The b) Which country has a comparative advantage in the
marginal cost of a 12-ounce can of beer is $0.50. The production of watches? in the production of automo-
marginal cost of a 12-ounce tin of peanuts is $1.00. biles?
Currently, the economy is producing 1 million 12-ounce
cans of beer and 2 million 12-ounce tins of peanuts. The 16.23. Brazil and China can produce cotton and soy-
marginal rates of technical substitution of labor for capital beans. The labor required to produce a unit of each
in the beer and peanut industries are the same. Moreover, product is shown in the following table:
there are 1 million identical consumers in the economy, Brazilian and Chinese Labor Requirements
each with a marginal rate of substitution of beer for Cotton (labor-hours Soybeans (labor-hours
peanuts given by MRS x, y 3y/x. per unit) per unit)
a) Sketch a graph of the economy’s production possibili-
ties frontier. Identify the economy’s current output on China 20 100
this graph. Brazil 10 80
b) Does the existing allocation satisfy substitution effi- a) Which country has an absolute advantage in the pro-
ciency? Why or why not?
duction of cotton? In the production of soybeans?
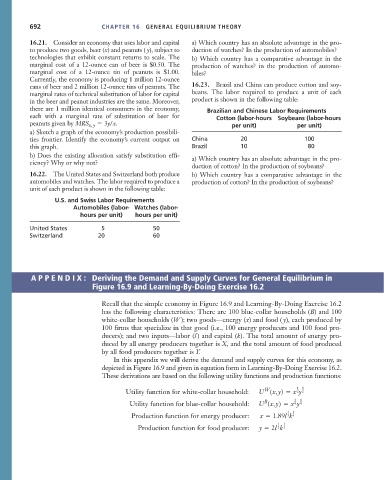
16.22. The United States and Switzerland both produce b) Which country has a comparative advantage in the
automobiles and watches. The labor required to produce a production of cotton? In the production of soybeans?
unit of each product is shown in the following table:
U.S. and Swiss Labor Requirements
Automobiles (labor- Watches (labor-
hours per unit) hours per unit)
United States 5 50
Switzerland 20 60
APPENDIX: Deriving the Demand and Supply Curves for General Equilibrium in
Figure 16.9 and Learning-By-Doing Exercise 16.2
Recall that the simple economy in Figure 16.9 and Learning-By-Doing Exercise 16.2
has the following characteristics: There are 100 blue-collar households (B) and 100
white-collar households (W ); two goods—energy (x) and food ( y), each produced by
100 firms that specialize in that good (i.e., 100 energy producers and 100 food pro-
ducers); and two inputs—labor (l ) and capital (k). The total amount of energy pro-
duced by all energy producers together is X, and the total amount of food produced
by all food producers together is Y.
In this appendix we will derive the demand and supply curves for this economy, as
depicted in Figure 16.9 and given in equation form in Learning-By-Doing Exercise 16.2.
These derivations are based on the following utility functions and production functions:
1
W
Utility function for white-collar household: U (x, y) x y 1 2
2
3
B
Utility function for blue-collar household: U (x, y) x y 1 4
4
1 2
Production function for energy producer: x 1.89l k 3
3
1 1
Production function for food producer: y 2l k 2
2