
Page 232 - Foundations of Marketing
P. 232
Reaching Global Markets | Chapter 8 199
in standards of living, credit, buying power, income distribution, national resources,
exchange rates, and the like—dictate many of the adjustments firms must make in marketing
internationally.
Instability is one of the guaranteed constants in the global business environment. The
United States and the European Union are more stable economically than many other regions
of the world. However, even these economies have downturns in regular cycles, and the most
recent recession significantly slowed business growth. A number of other countries, includ-
ing Korea, Russia, Singapore, and Thailand, have all experienced economic problems, such
as depressions, high unemployment, corporate bankruptcies, instabilities in currency mar-
kets, trade imbalances, and financial systems that need major reforms. For instance, the ris-
ing power of raw materials could increase inflation in developing countries where demand is
11
growing. The constantly fluctuating conditions in different economies require global mar-
keters to carefully monitor the global environment and make changes quickly. Even more
stable developing countries, such as Mexico and Brazil, tend to have greater fluctuations in
their business cycles than the United States does. Despite this fact, the United States had its
debt rating downgraded in 2011 due to continual deficit spending. Economic instability can
also disrupt the markets for U.S. products in places that otherwise might be excellent mar-
keting opportunities. On the other hand, competition from the sustained economic growth of
countries like China and India can disrupt markets for U.S. products.
The value of the dollar, euro, and yen has a major impact on the prices of products in
many countries. An important economic factor in the global business environment is currency
valuation. Many countries have adopted a floating exchange rate, which allows the currencies
of those countries to fluctuate, or float, according to the foreign exchange market. China is
continually criticized for undervaluing its currency, or valuing its currency below the mar-
ket value. This gives it an advantage in selling exports, since the Chinese yuan has a lower
value than other nations’ currencies. It also decreases demand for manufacturers and exporters
12
from other countries. The value of the U.S. dollar is also important to the global economy.
gross domestic product
Because many countries float their exchange rates around the dollar, too much or too little (GDP) The market value of a
13
U.S. currency in the economy could create inflationary effects or harm exports.
nation’s total output of goods
In terms of the value of all products produced by a nation, the United States has the largest and services for a given period;
14
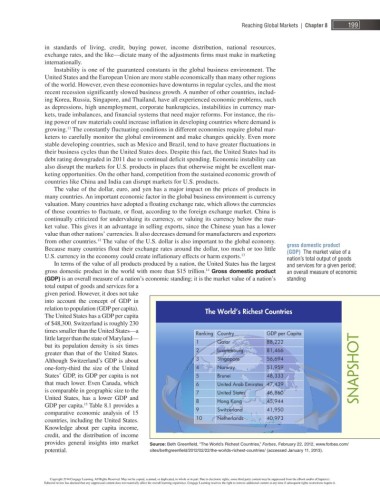
gross domestic product in the world with more than $ 15 trillion. Gross domestic product an overall measure of economic
(GDP) is an overall measure of a nation’s economic standing; it is the market value of a nation’s standing
total output of goods and services for a
given period. However, it does not take
into account the concept of GDP in
relation to population (GDP per capita). The World’s Richest Countries
The United States has a GDP per capita
of $ 48,300 . Switzerland is roughly 230
times smaller than the United States—a
Ranking Country GDP per Capita
little larger than the state of Maryland—
1 Qatar 88,222
but its population density is six times
2 Luxembourg 81,466
greater than that of the United States.
Although Switzerland’s GDP is about 3 Singapore 56,694
one-forty-third the size of the United 4 Norway 51,959 Snapshot
States’ GDP, its GDP per capita is not 5 Brunei 48,333
that much lower. Even Canada, which 6 United Arab Emirates 47,439
is comparable in geographic size to the 7 United States 46,860
United States, has a lower GDP and 8 Hong Kong 45,944
15
GDP per capita. Table 8.1 provides a
9 Switzerland 41,950
comparative economic analysis of 15
10 Netherlands 40,973
countries, including the United States.
Knowledge about per capita income,
credit, and the distribution of income
provides general insights into market Source: Beth Greenfi eld, “The World’s Richest Countries,” Forbes , February 22, 2012, www.forbes.com/
potential. sites/bethgreenfi eld/2012/02/22/the-worlds-richest-countries/ (accessed January 11, 2013).
Copyright 2014 Cengage Learning. All Rights Reserved. May not be copied, scanned, or duplicated, in whole or in part. Due to electronic rights, some third party content may be suppressed from the eBook and/or eChapter(s).
Editorial review has deemed that any suppressed content does not materially affect the overall learning experience. Cengage Learning reserves the right to remove additional content at any time if subsequent rights restrictions require it.